
Circular 210: Earthquake catalogs for New Mexico and bordering areas: 1869 - 1998
We are a research and service division of:
 COVER:
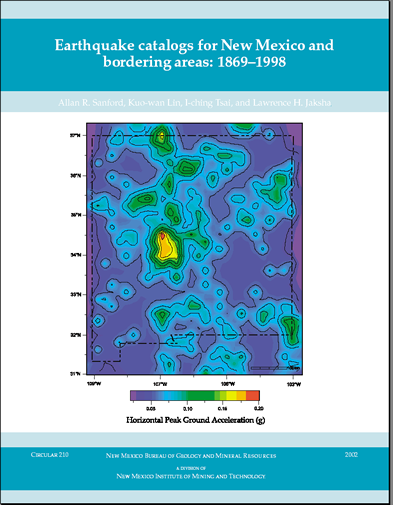
A probabilistic seismic hazard map for New Mexico based on earthquake data
from the catalogs in this publication. Seismic hazard maps commonly show
the expected geographic distribution of maximum ground motion from earthquake
activity. They are constructed for different percentages of probability
over a specified time period. The map on the cover shows expected maximum
or peak horizontal ground accelerations (PGA) that have a 10% probability
of being equaled or exceeded in a 50-yr period. The colors and contours
on the hazard map are scaled to ground acceleration as a fraction of the
earth's gravity g. The highest predicted PGA, ~0.18 g, is located ~40 km
(~25 mi) north of Socorro. A PGA of ~0.2 g is considered the acceleration
level at which considerable damage can begin to occur to weakly built or
designed structures-masonry structures of adobe and adobe and stone, for
example. With the exception of the Socorro area, predicted PGAs on the hazard
map are much less than 0.2 g. However, this map is based on instrumental
earthquake data collected from 1962 through 1998, a very short time period
to characterize the long-term seismicity of a region like New Mexico. Therefore
this map has a fairly high degree of uncertainty.
For technical details on how the hazard map was constructed, see: Lin, K.
W., 1999, Probabilistic seismic hazard in New Mexico and bordering areas:
Unpublished Ph.D. dissertation, New Mexico Institute of Mining and Technology,
New Mexico, 194 pp.
Other less detailed descriptions of the technical details of the hazard
map can be obtained from New Mexico Tech geophysics open-file reports available
at http://dutchman.nmt.edu/~nmquakes/
Return to Circular 209