


Open-file Report -
610
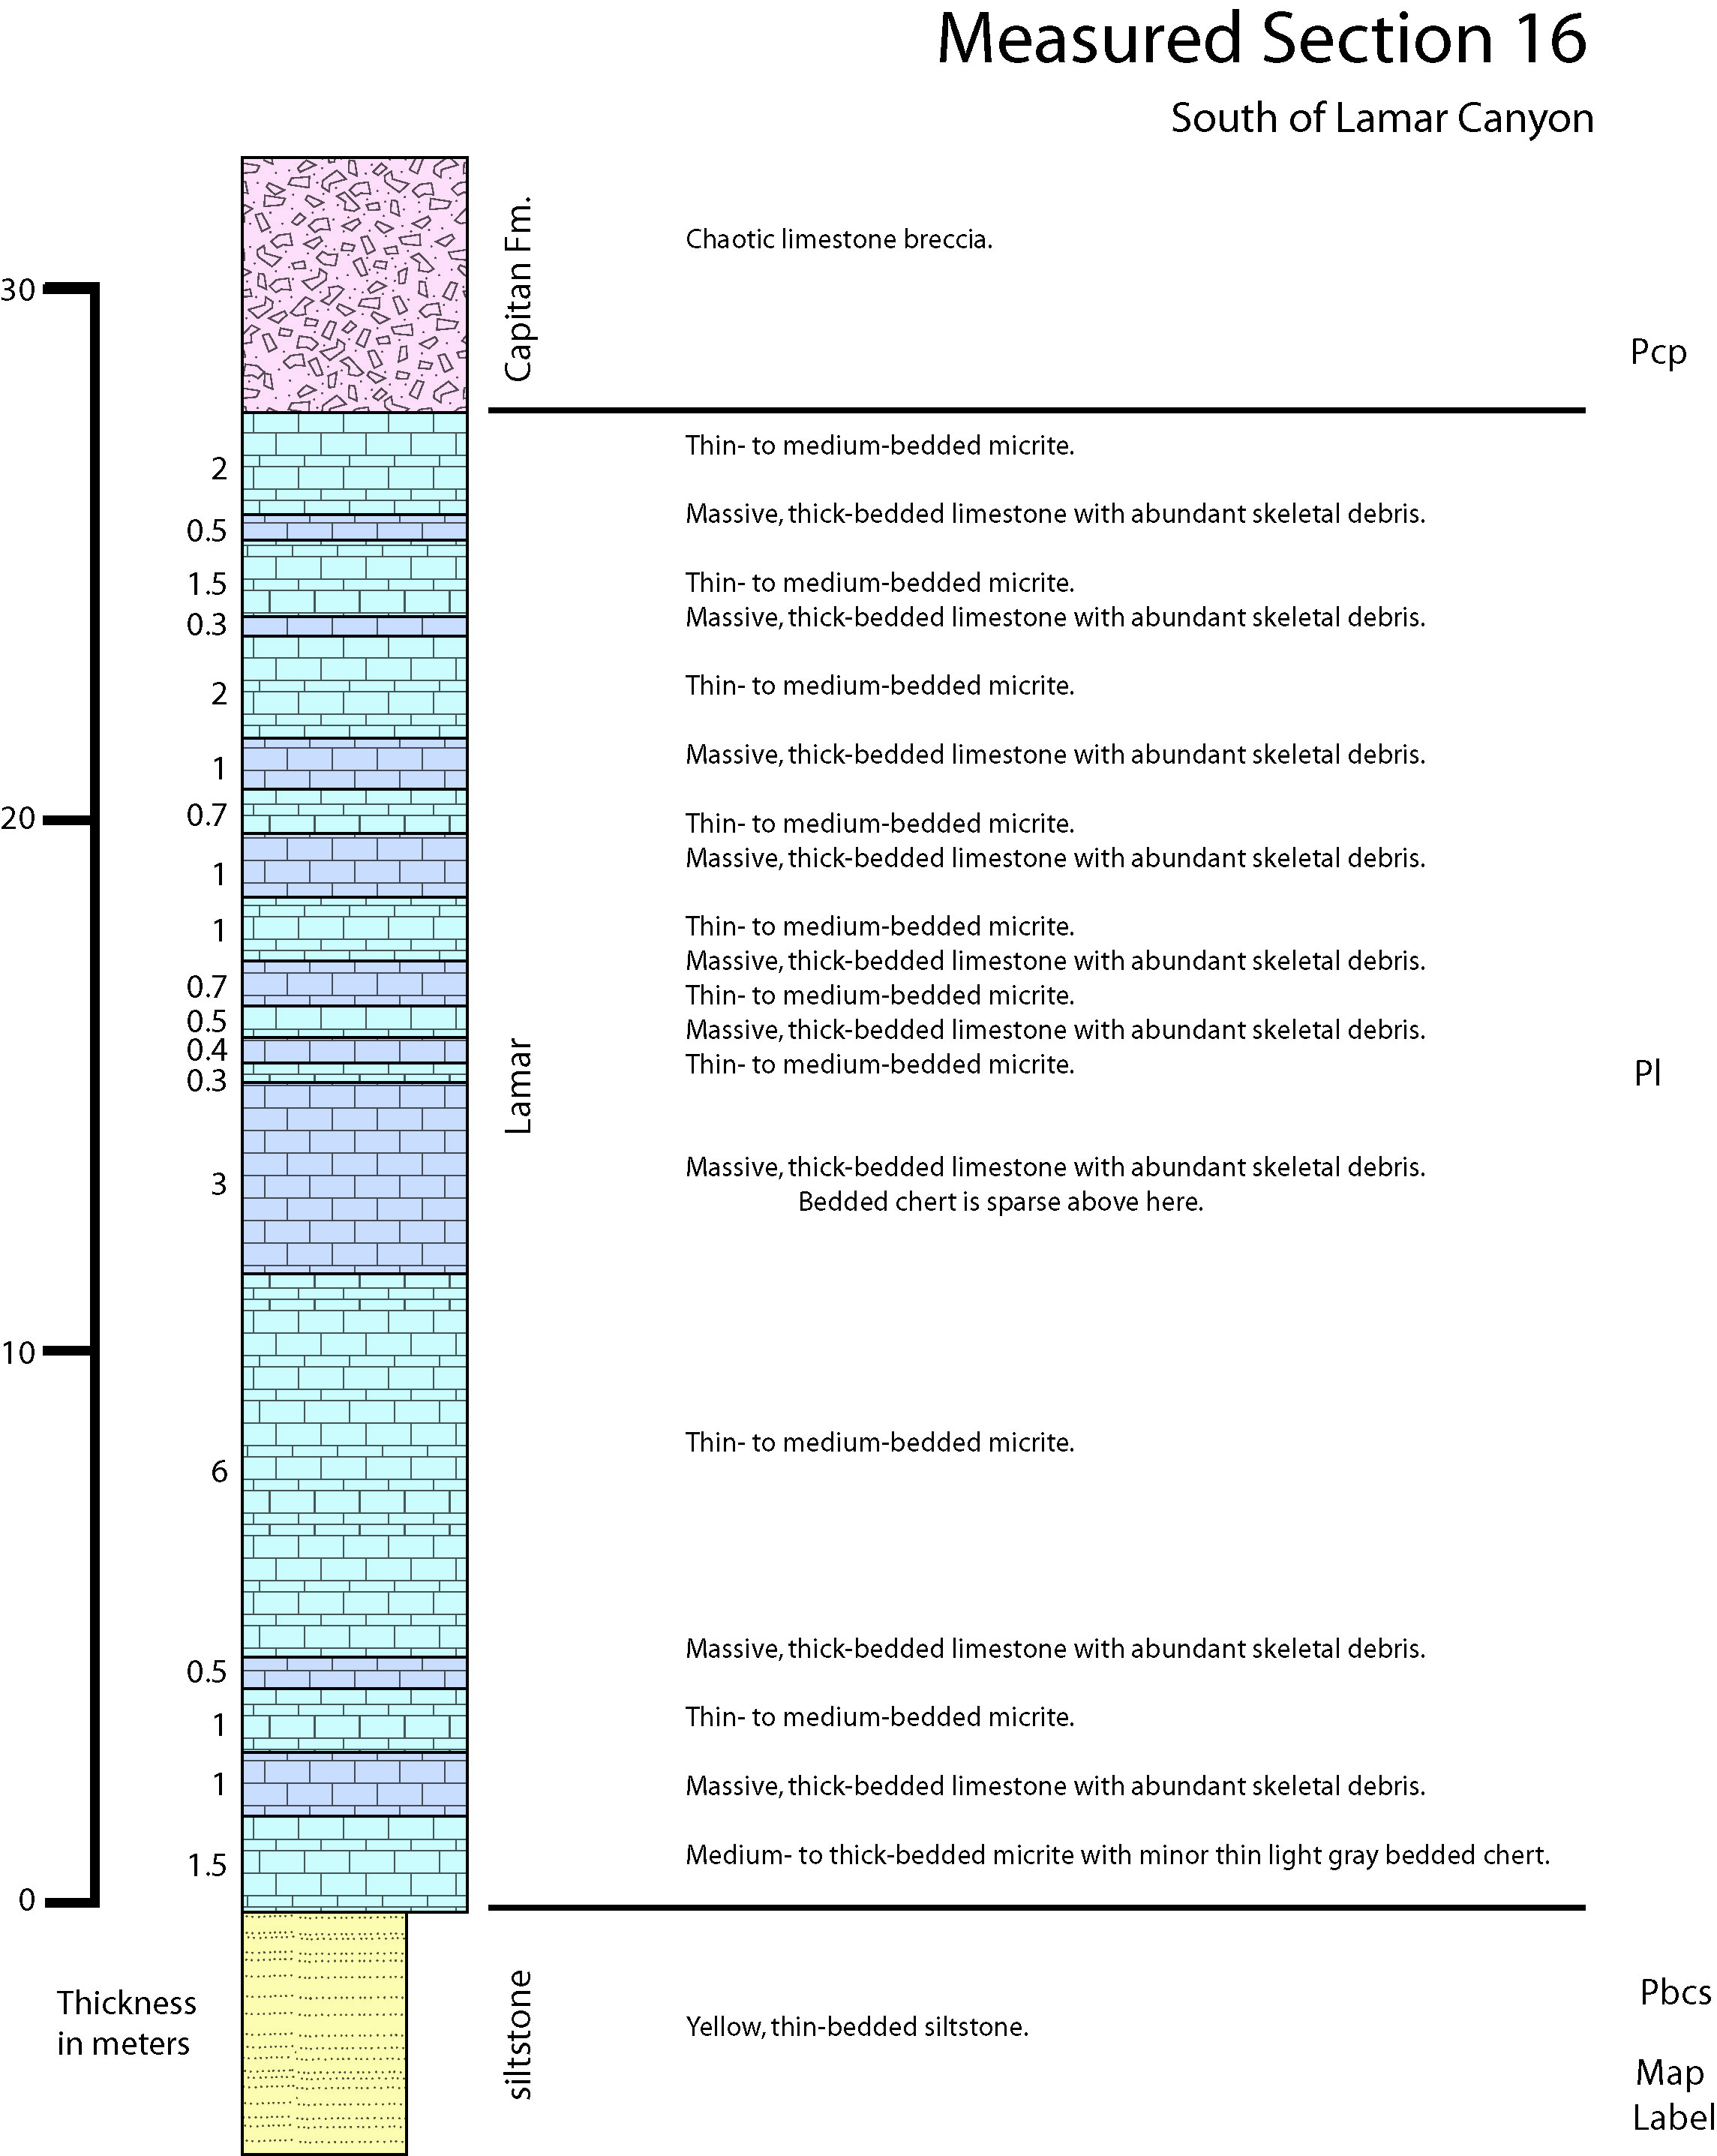
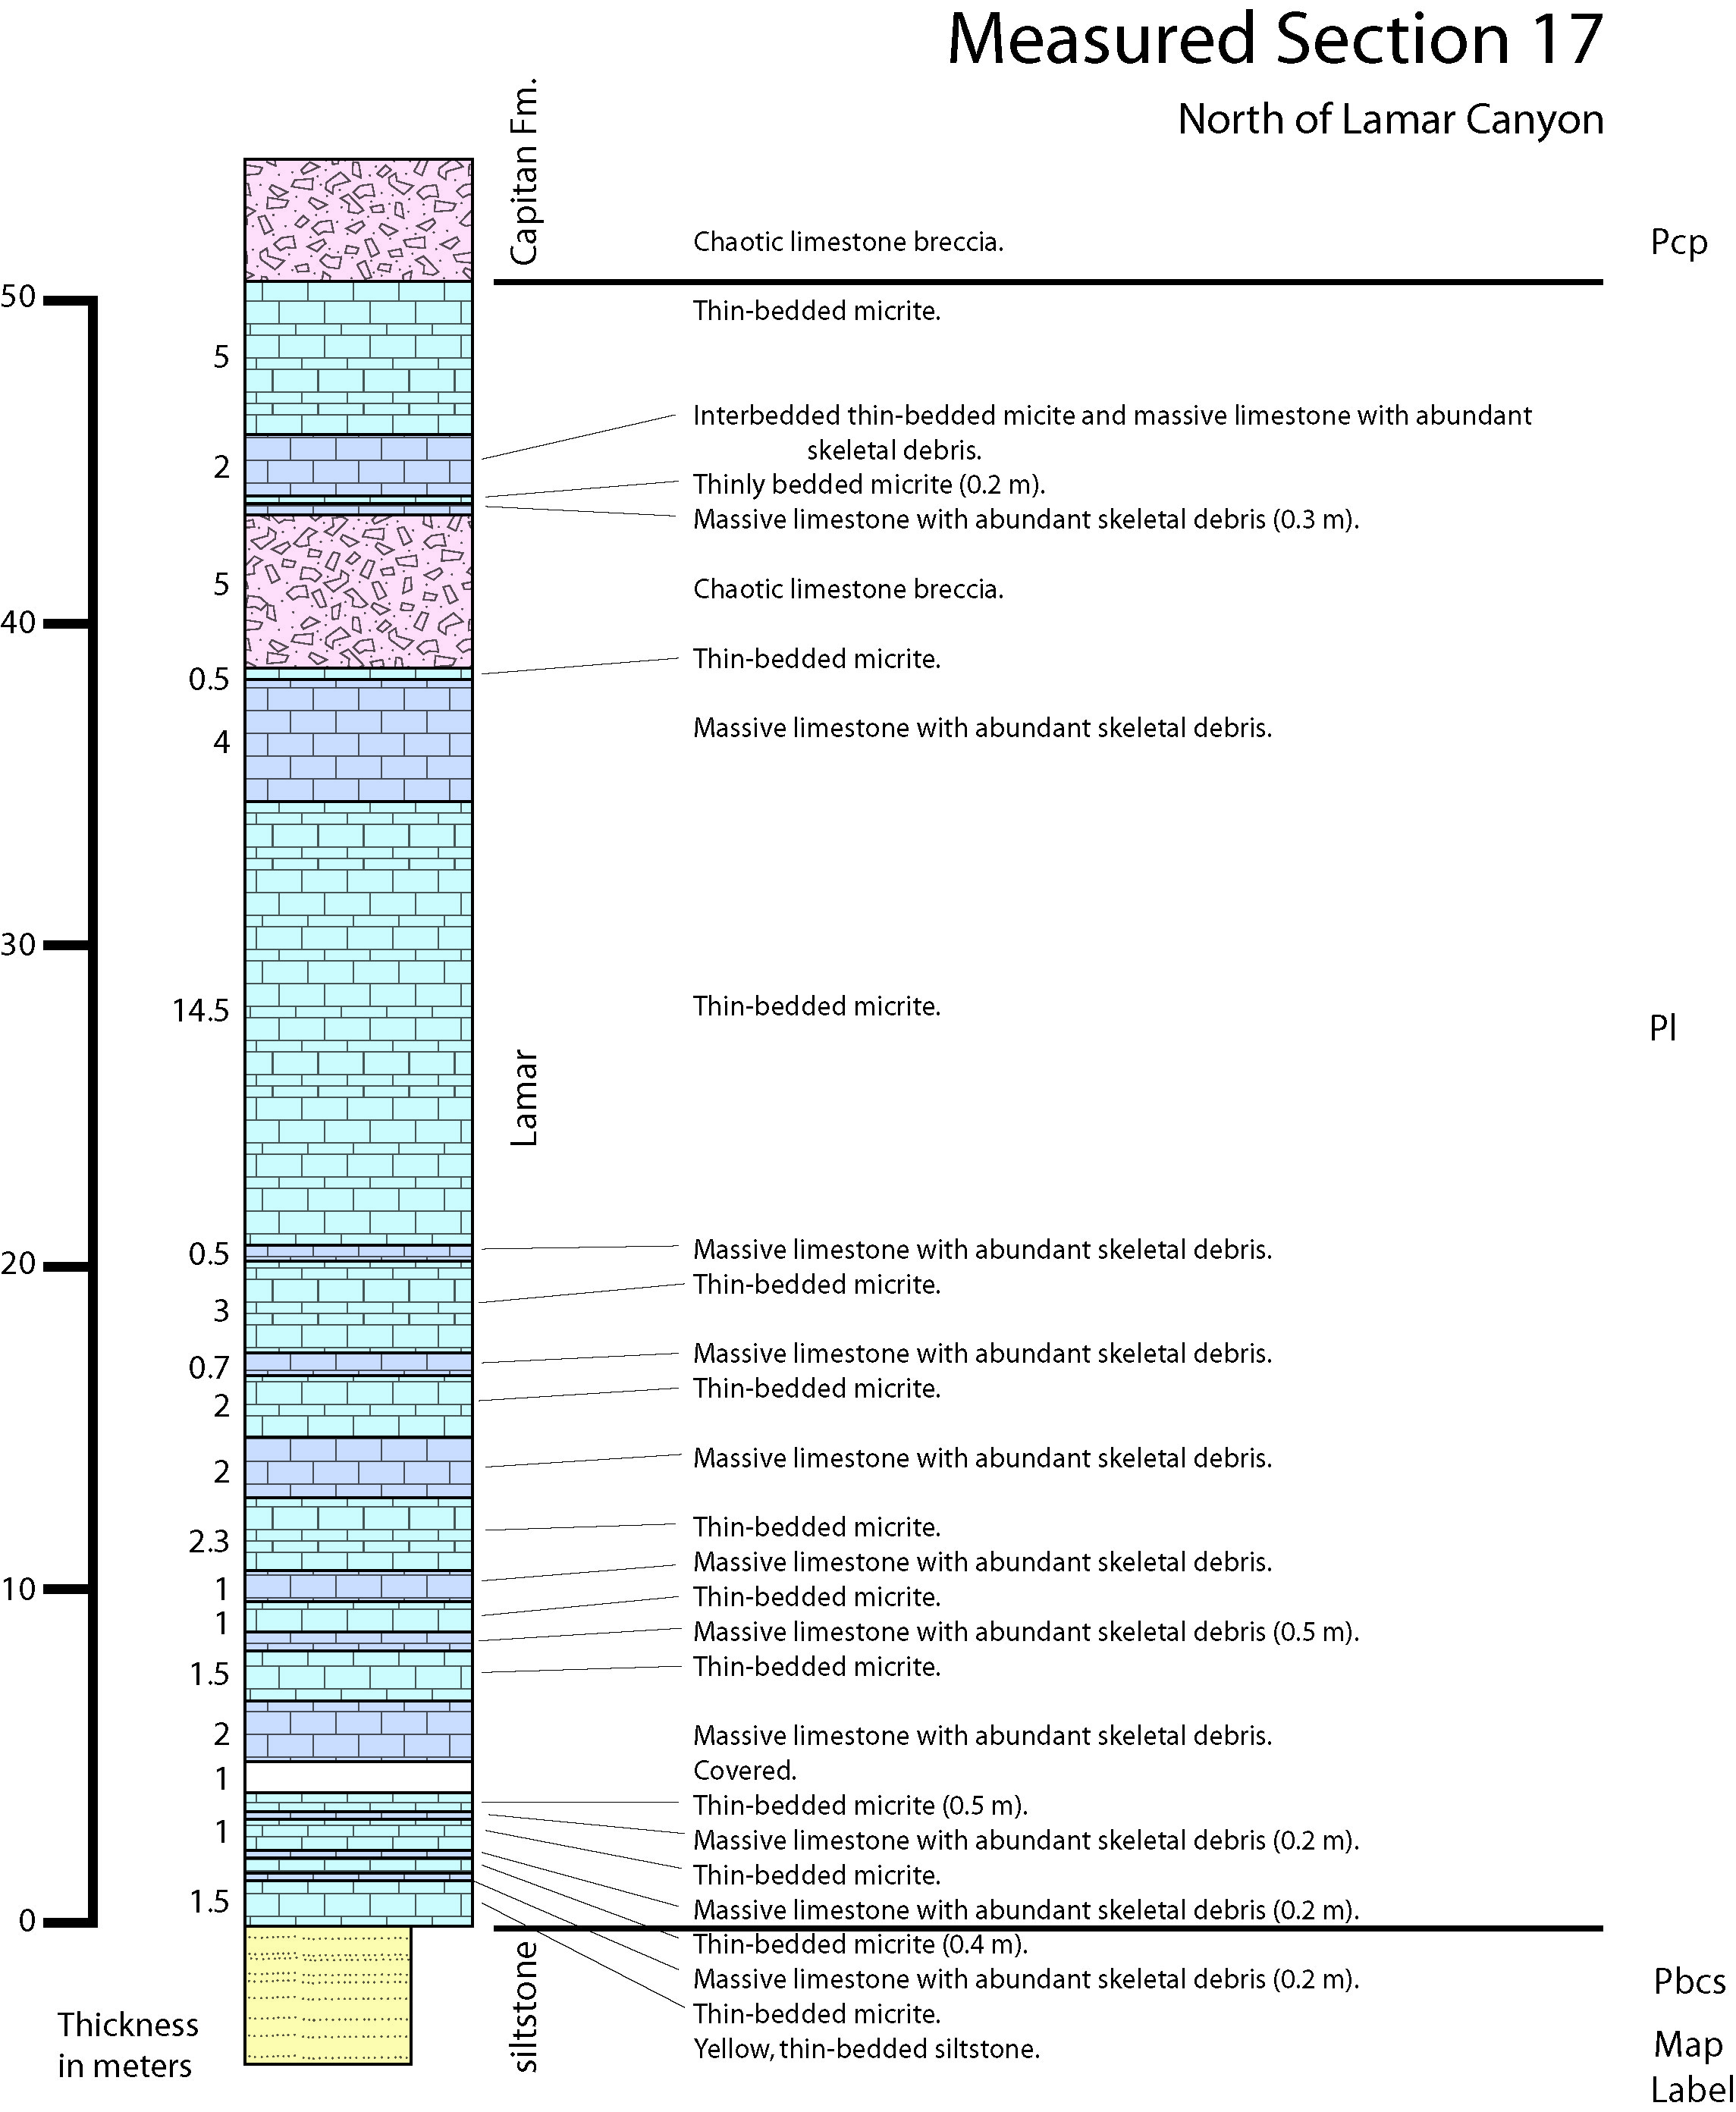
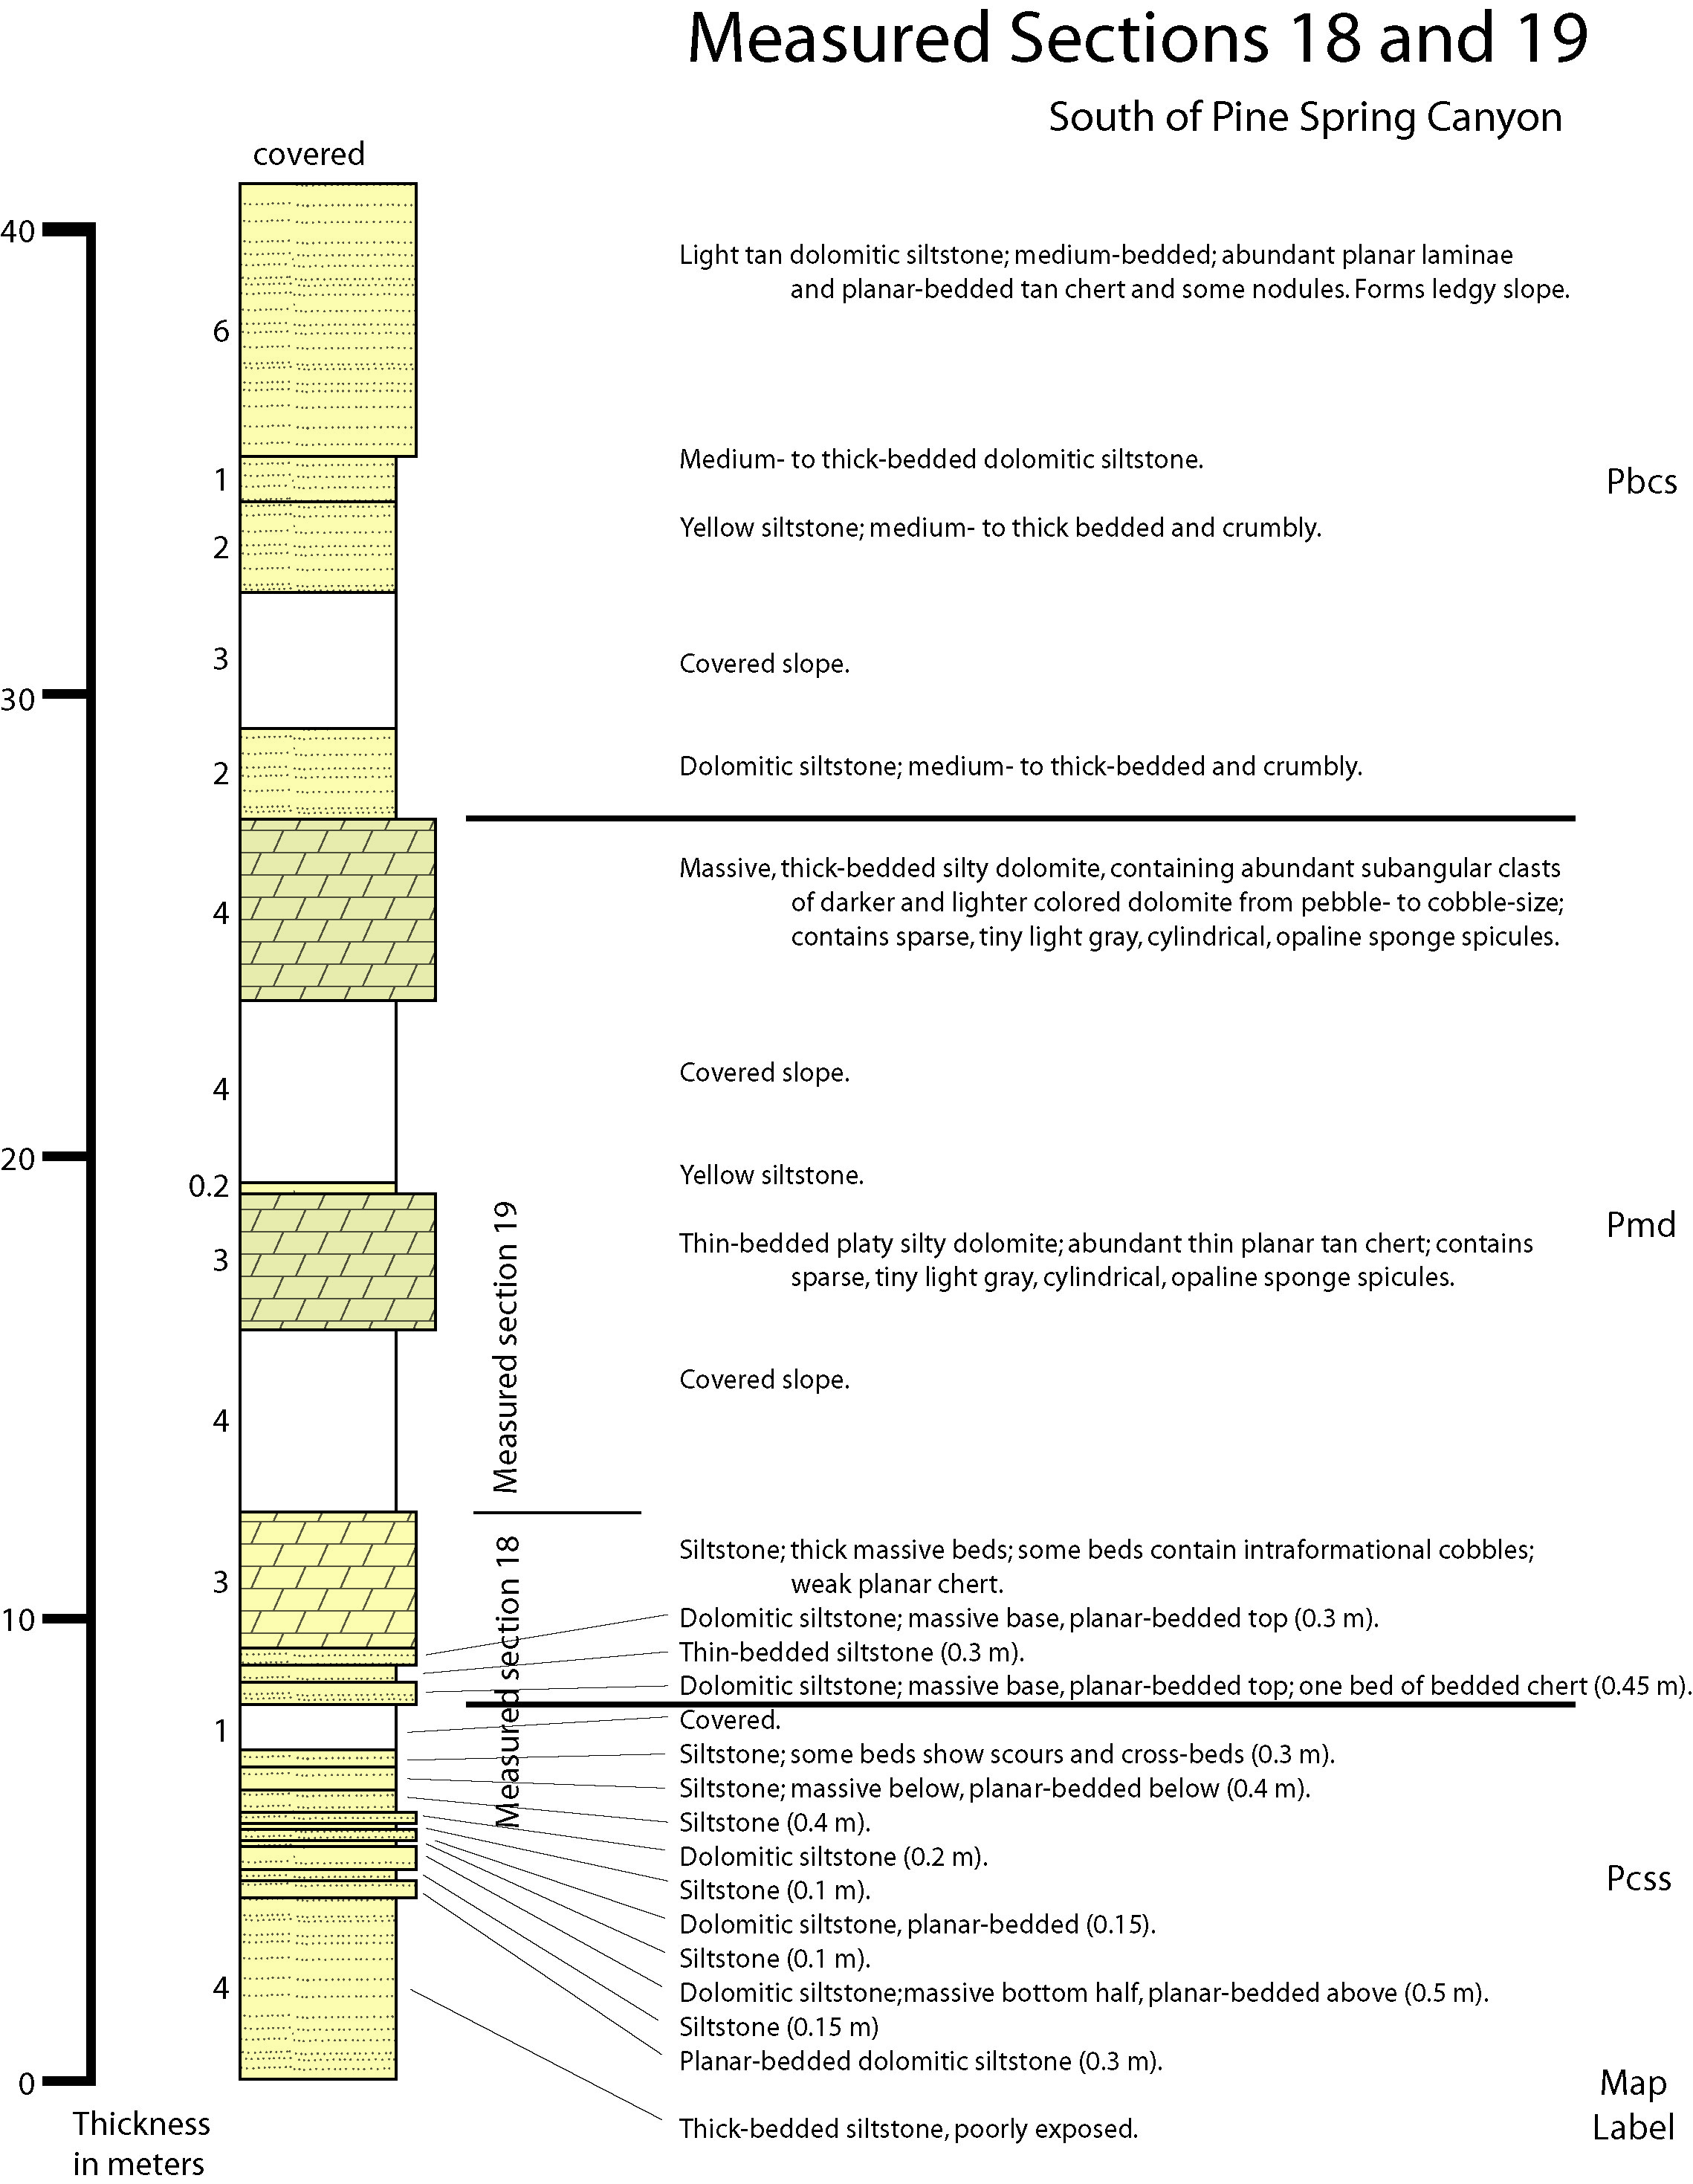
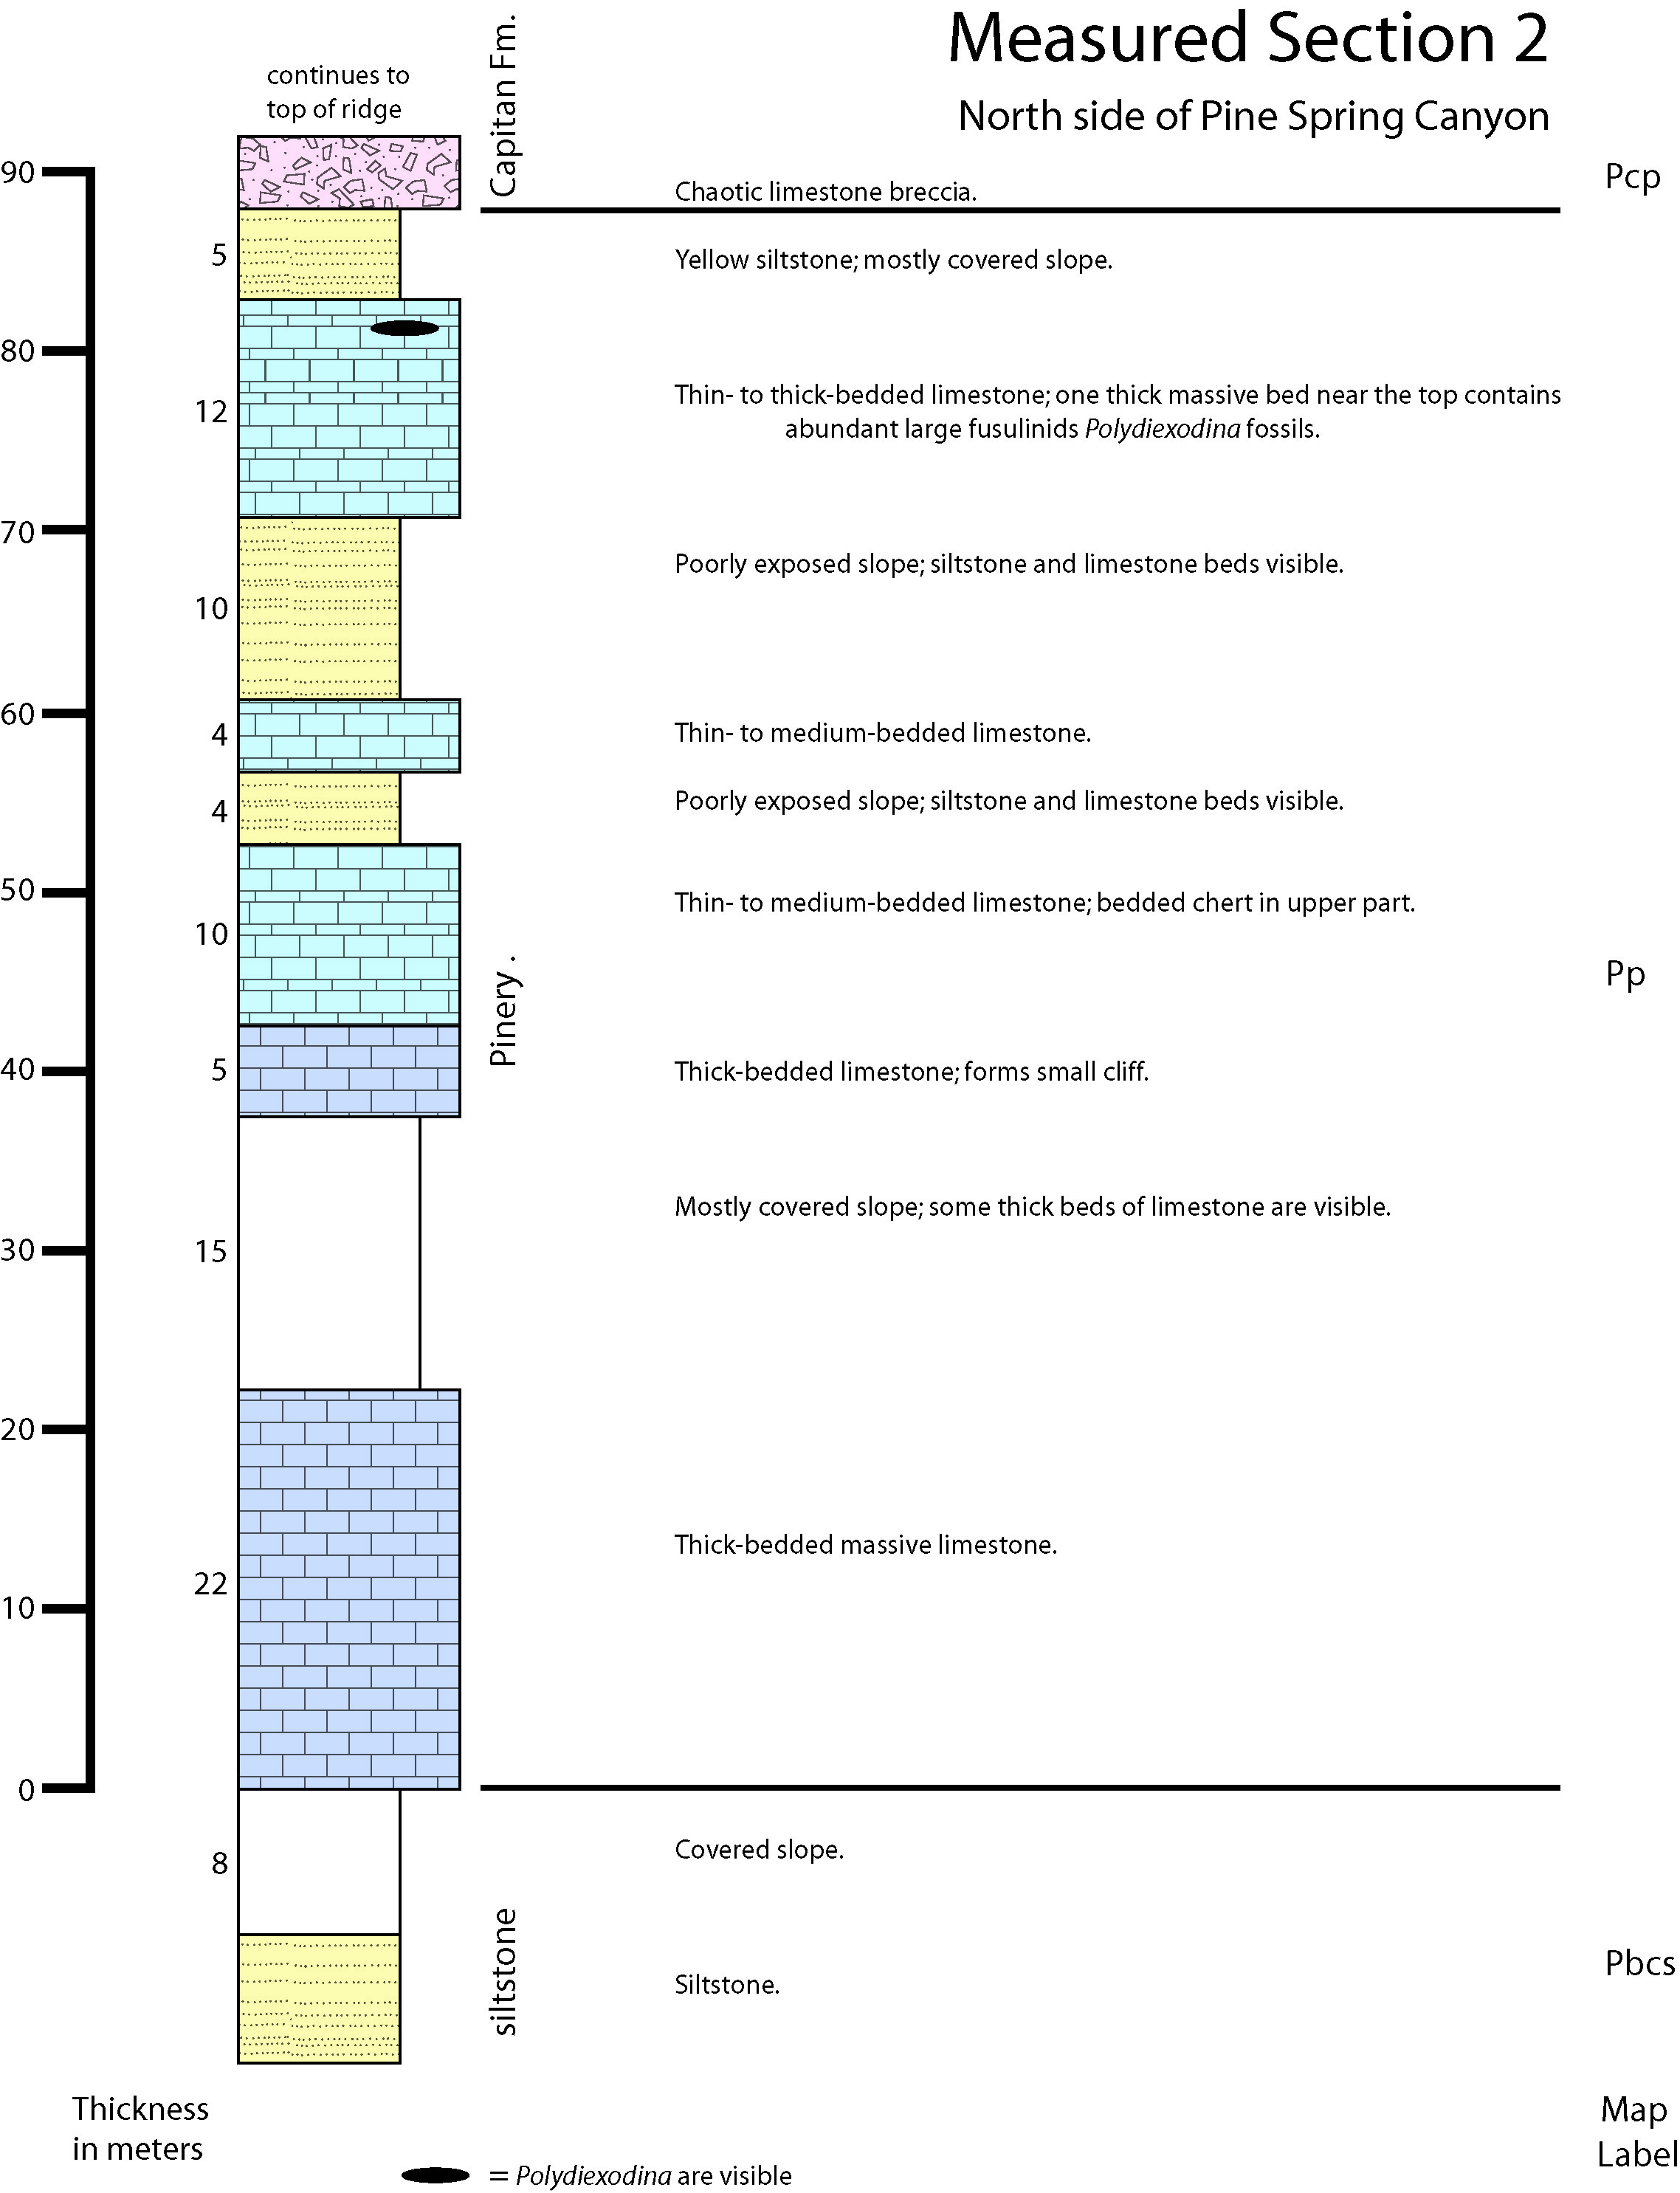
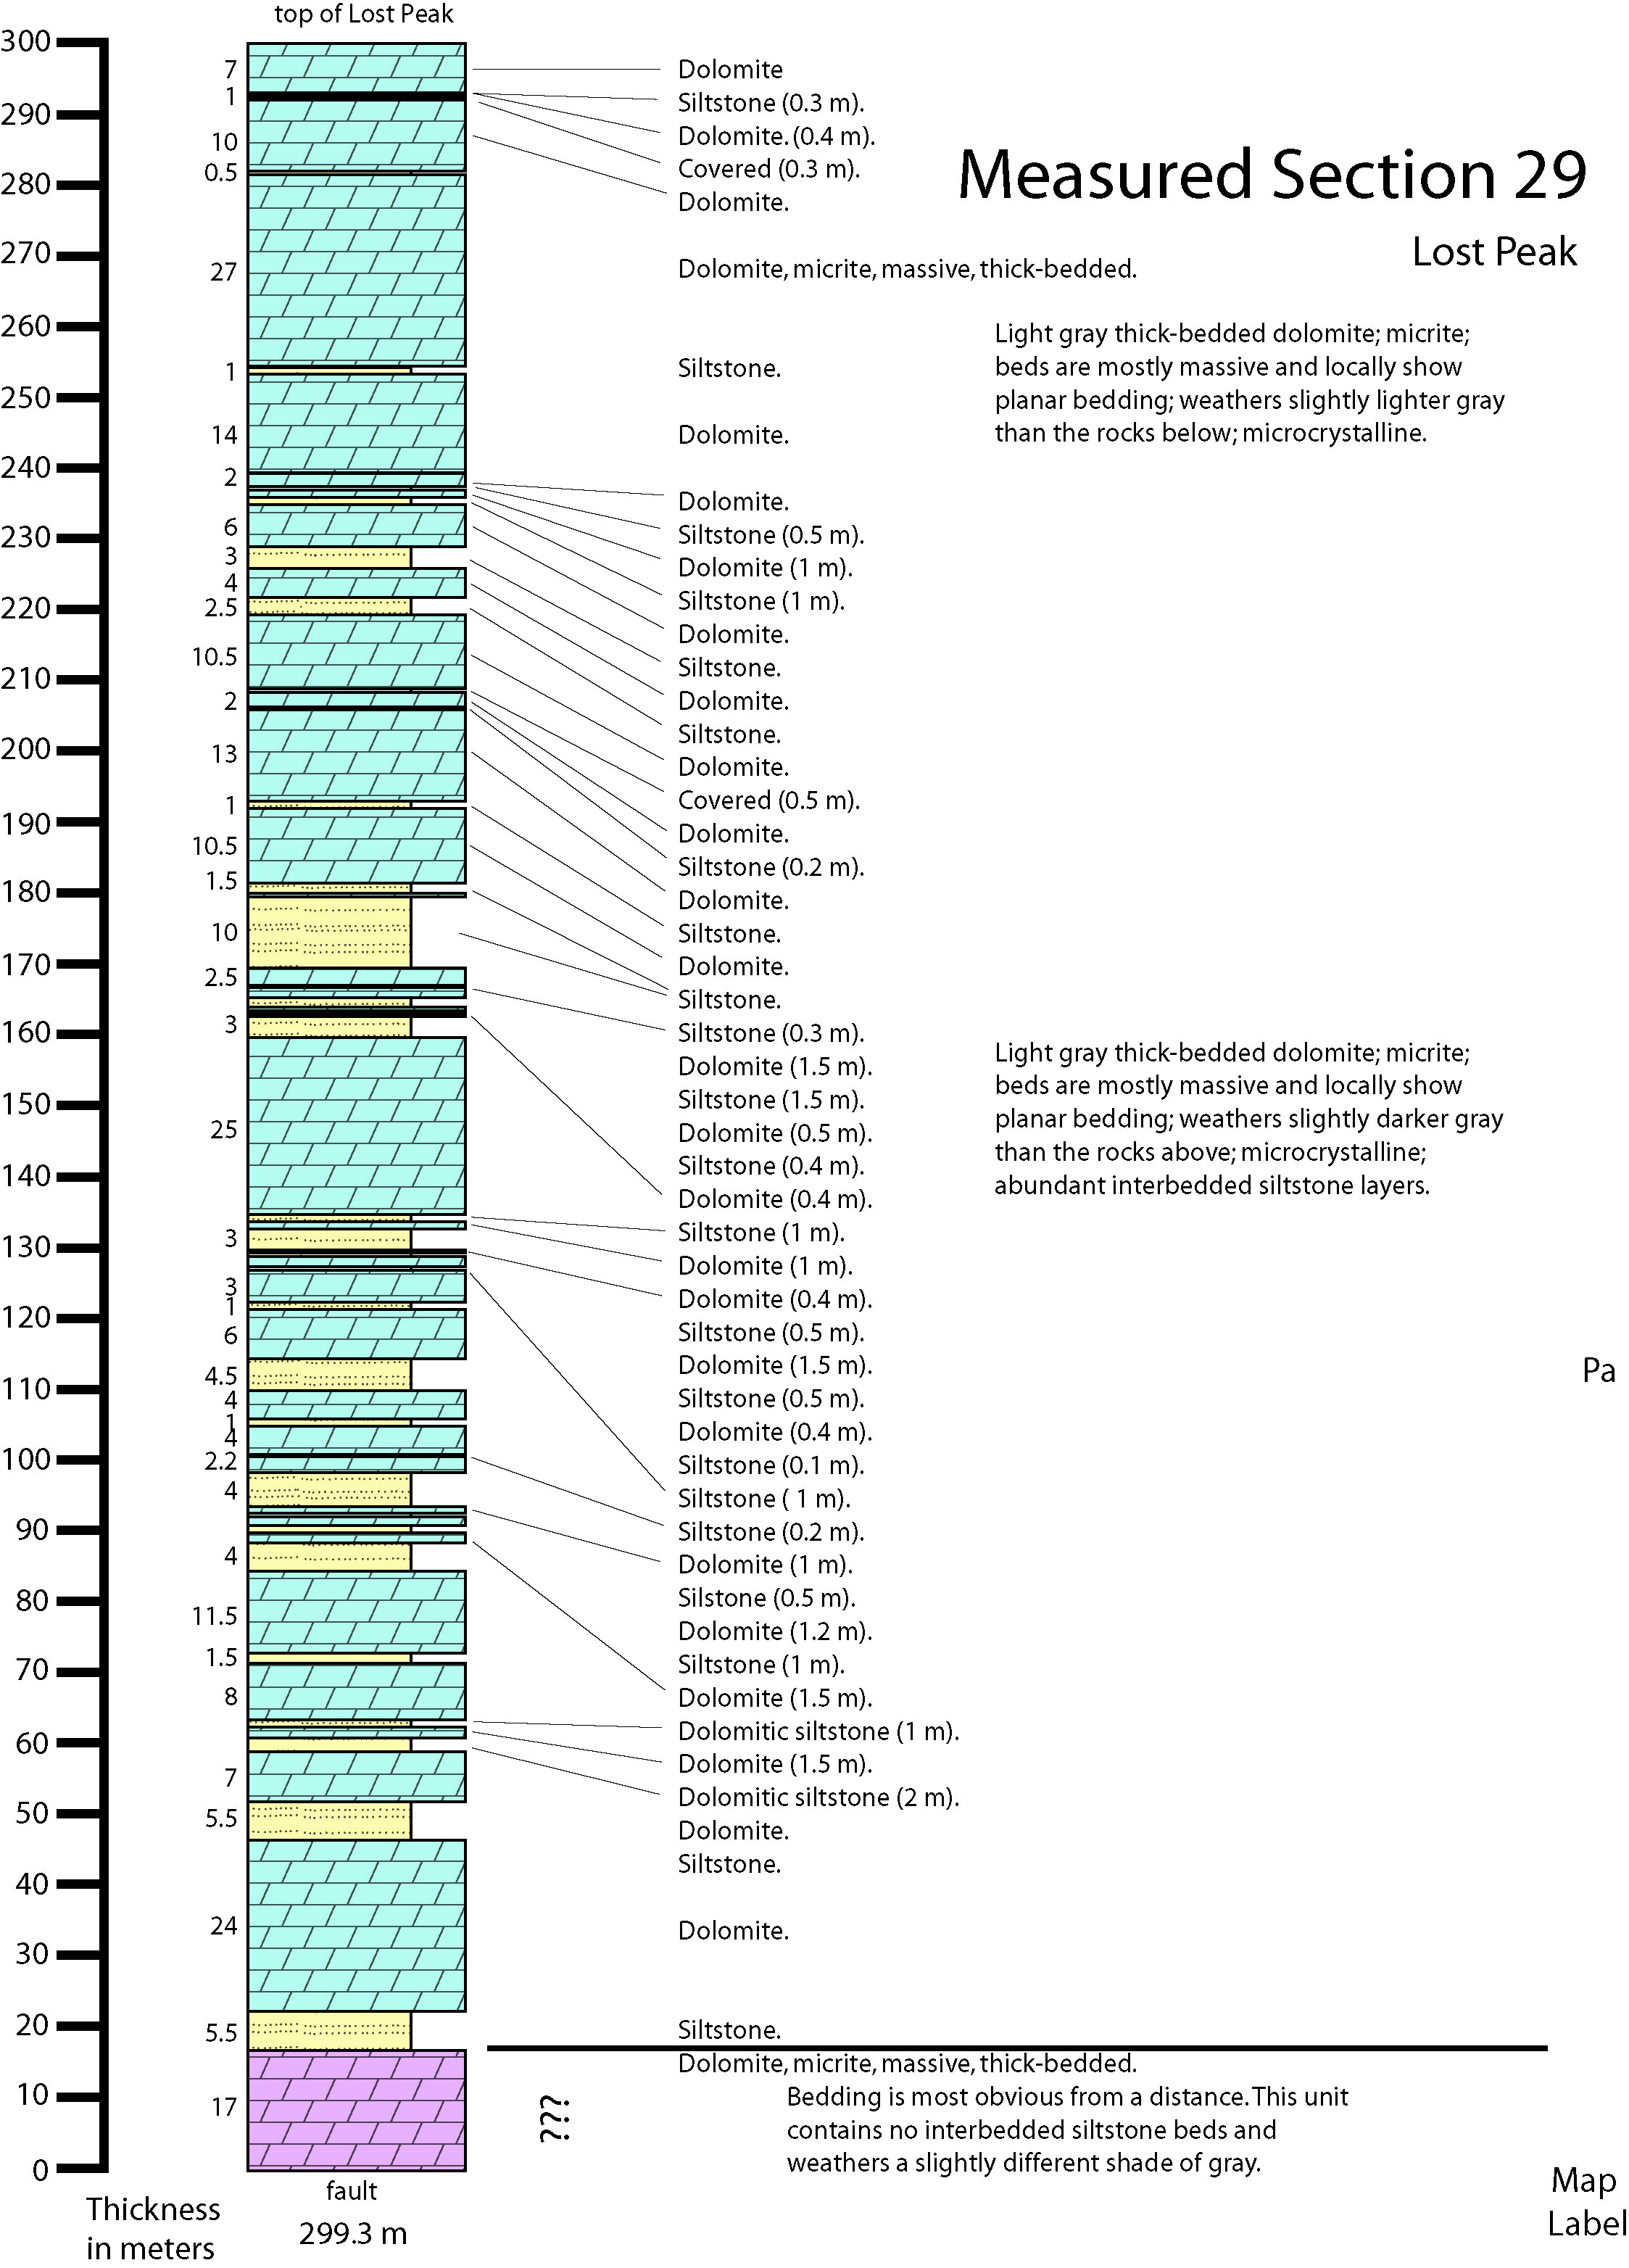
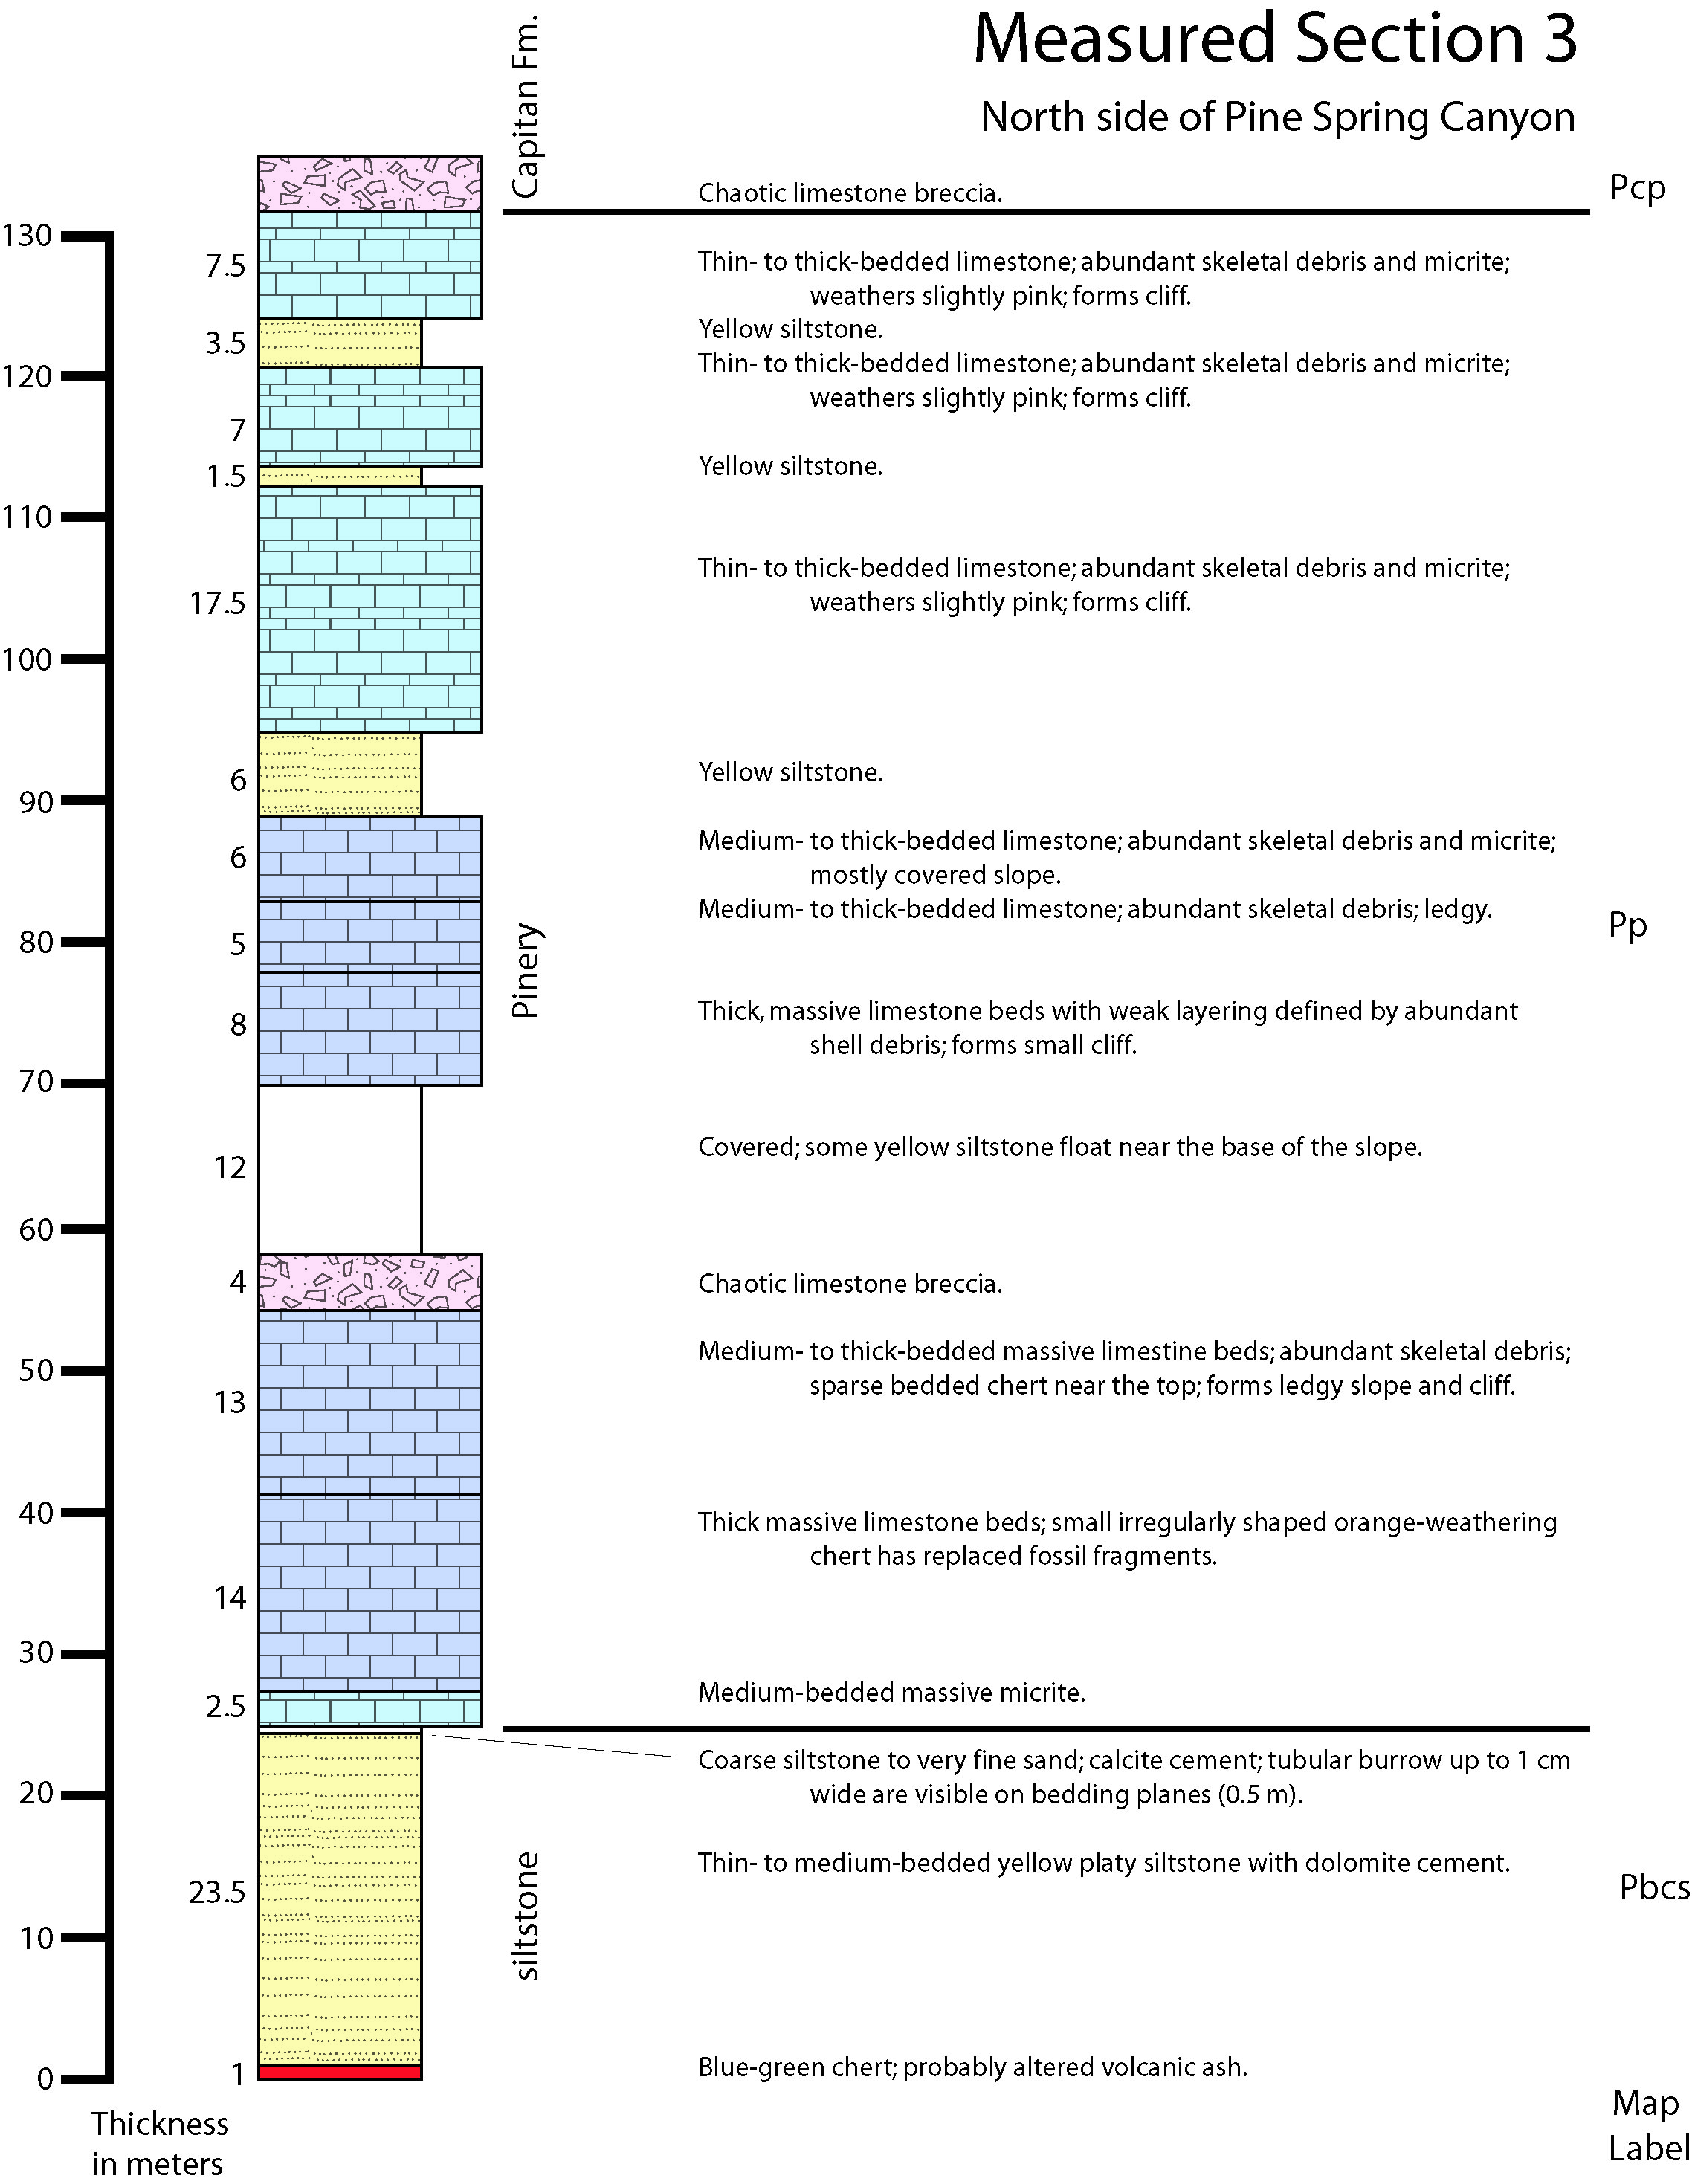
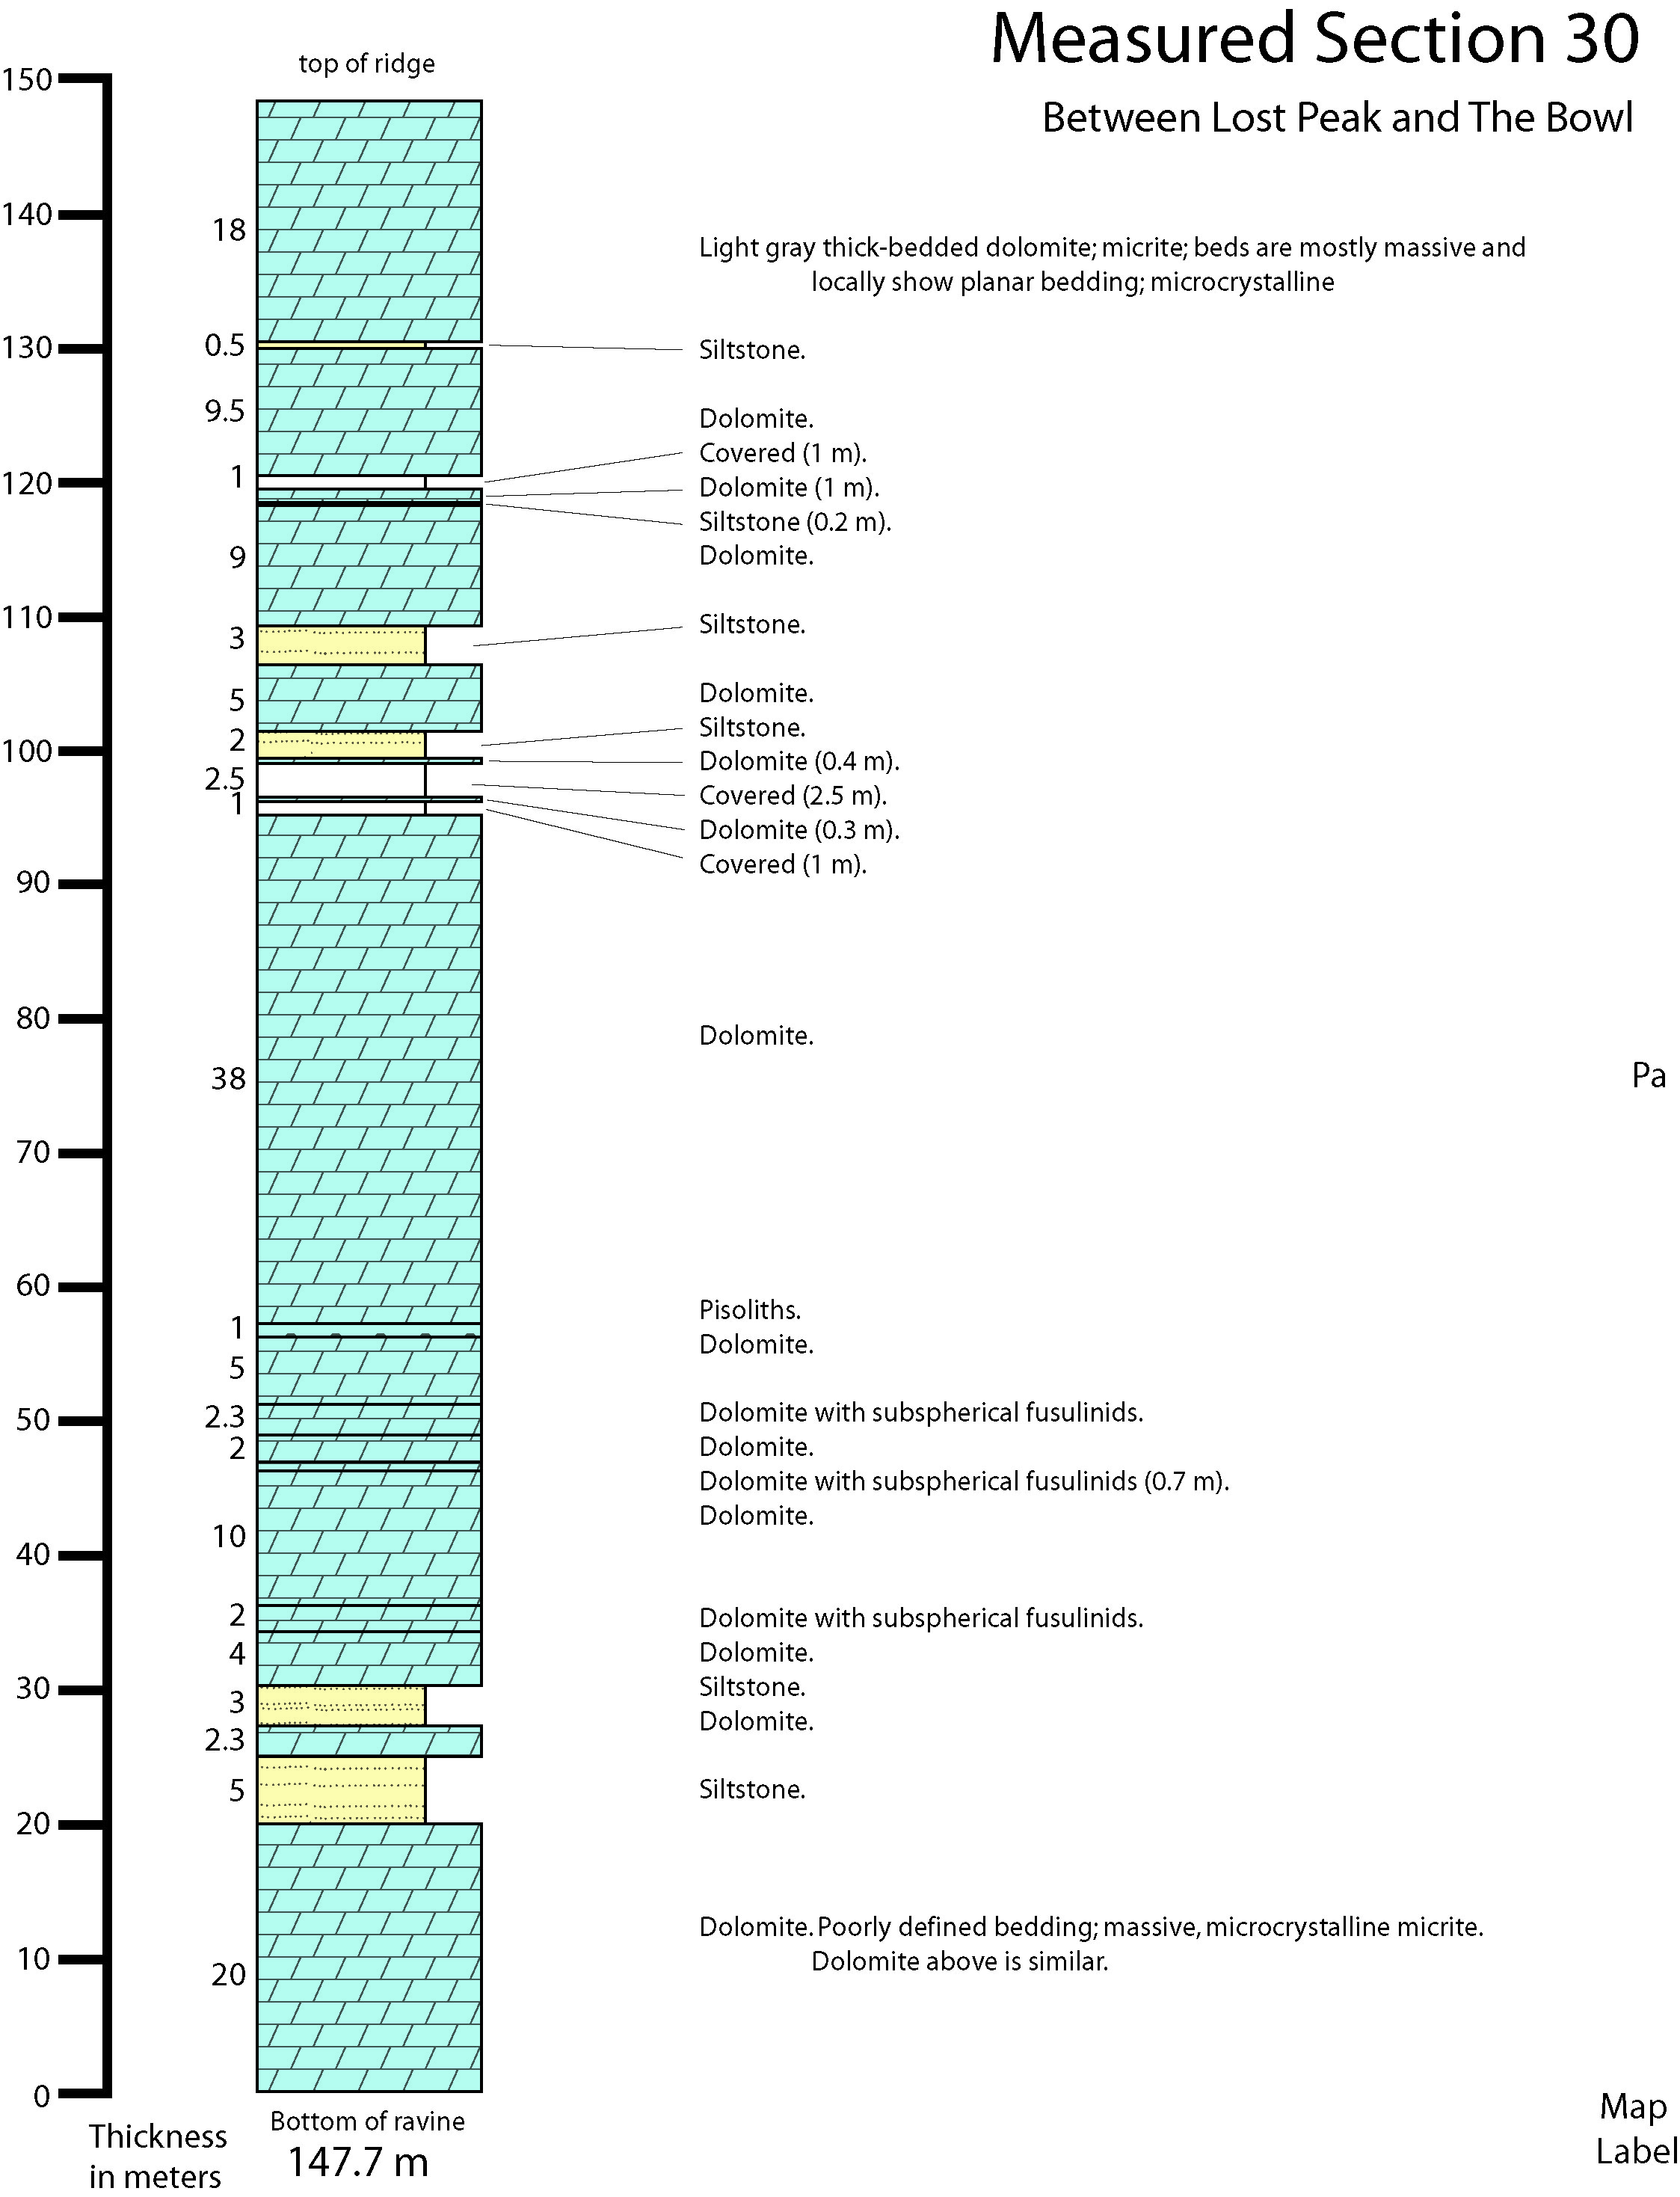
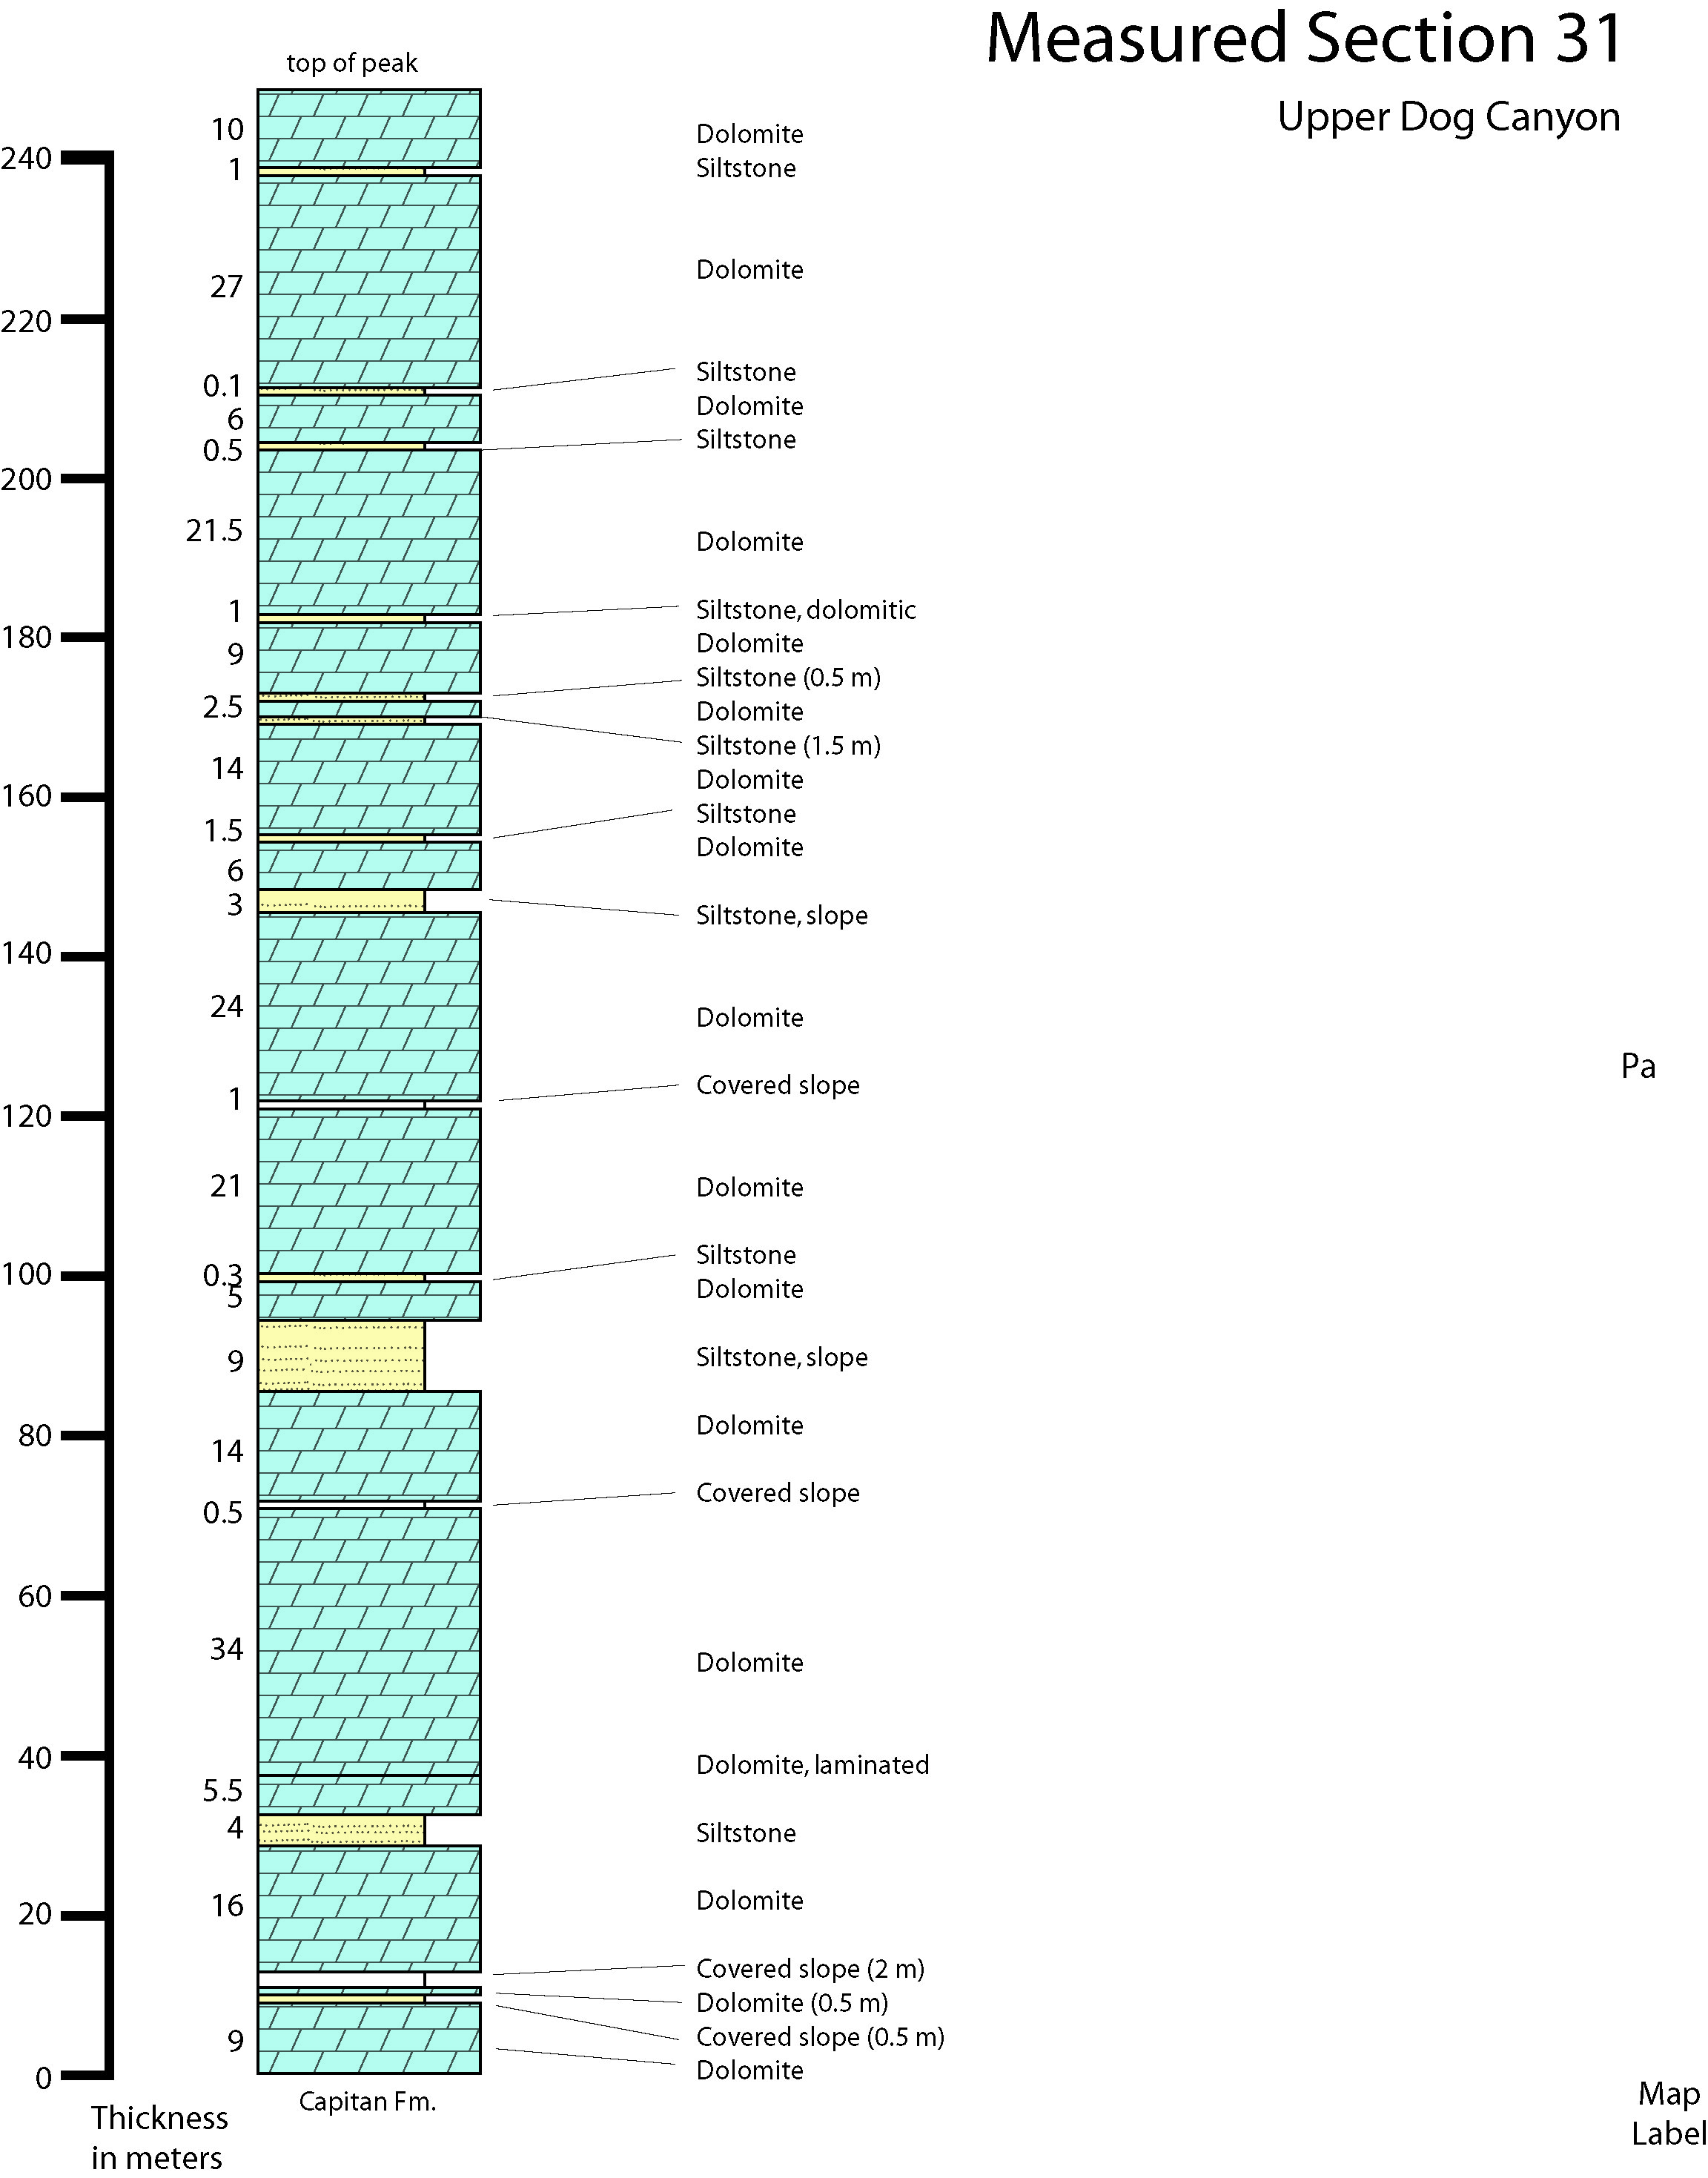
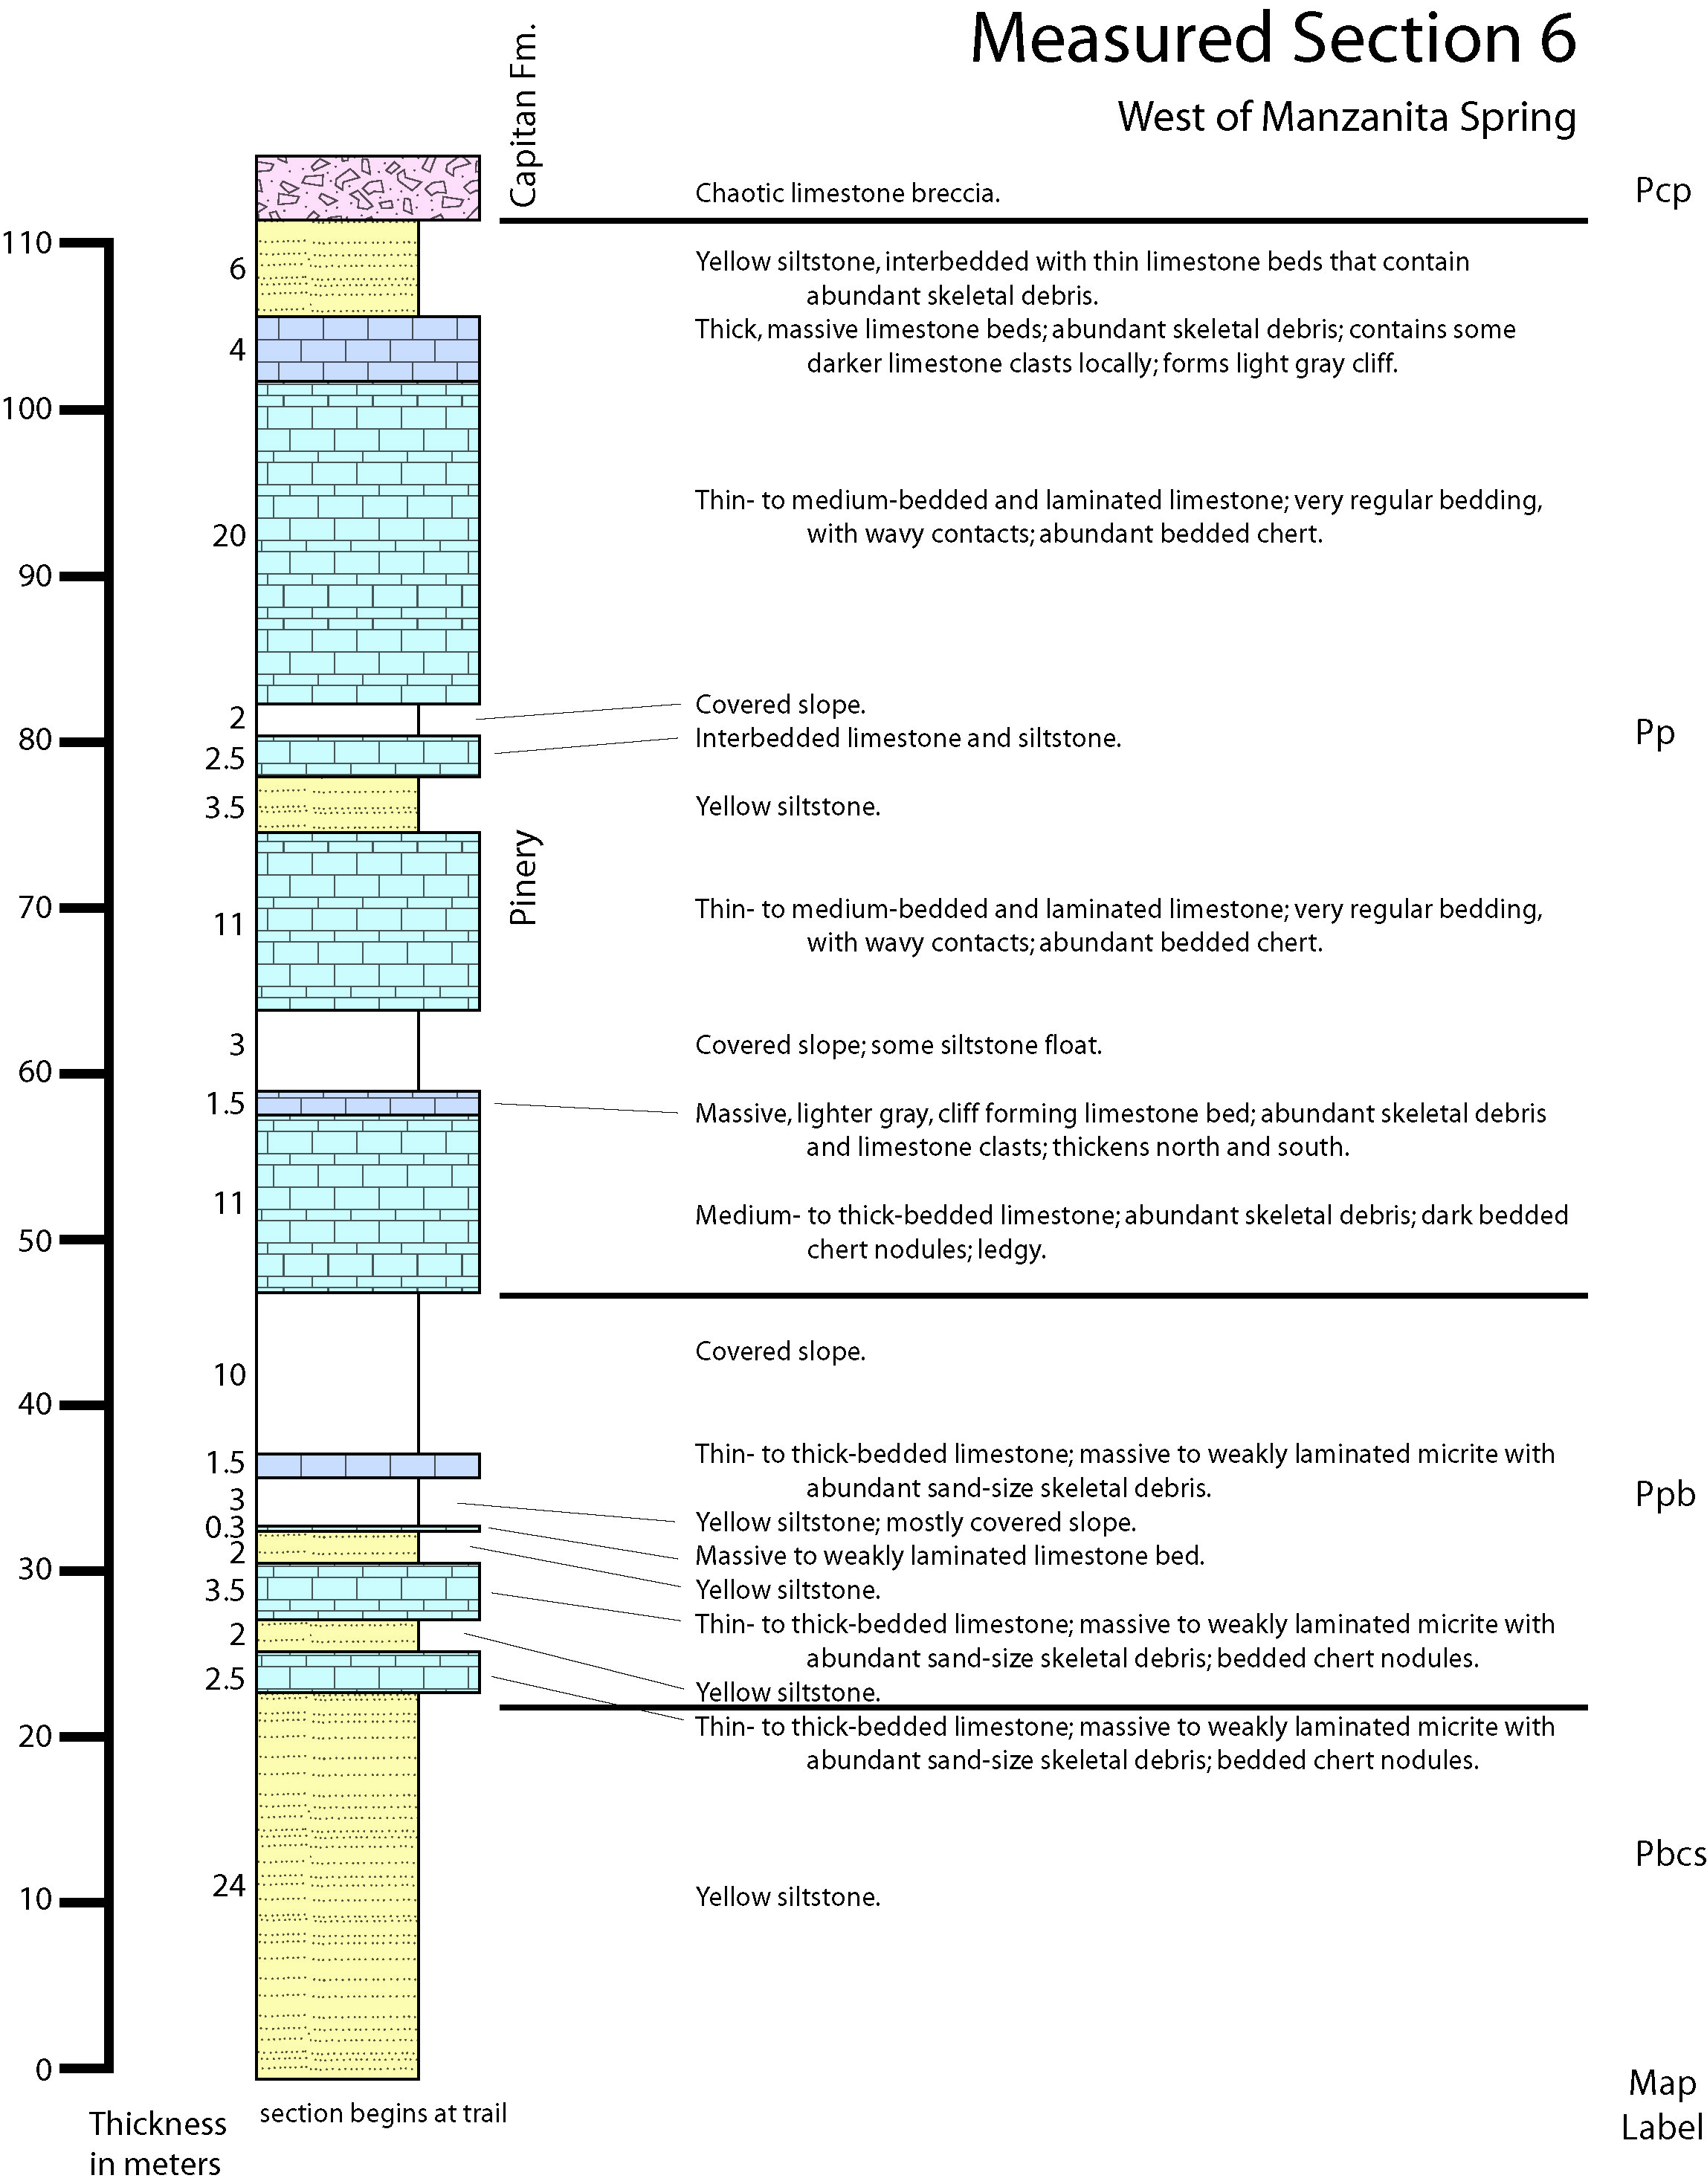
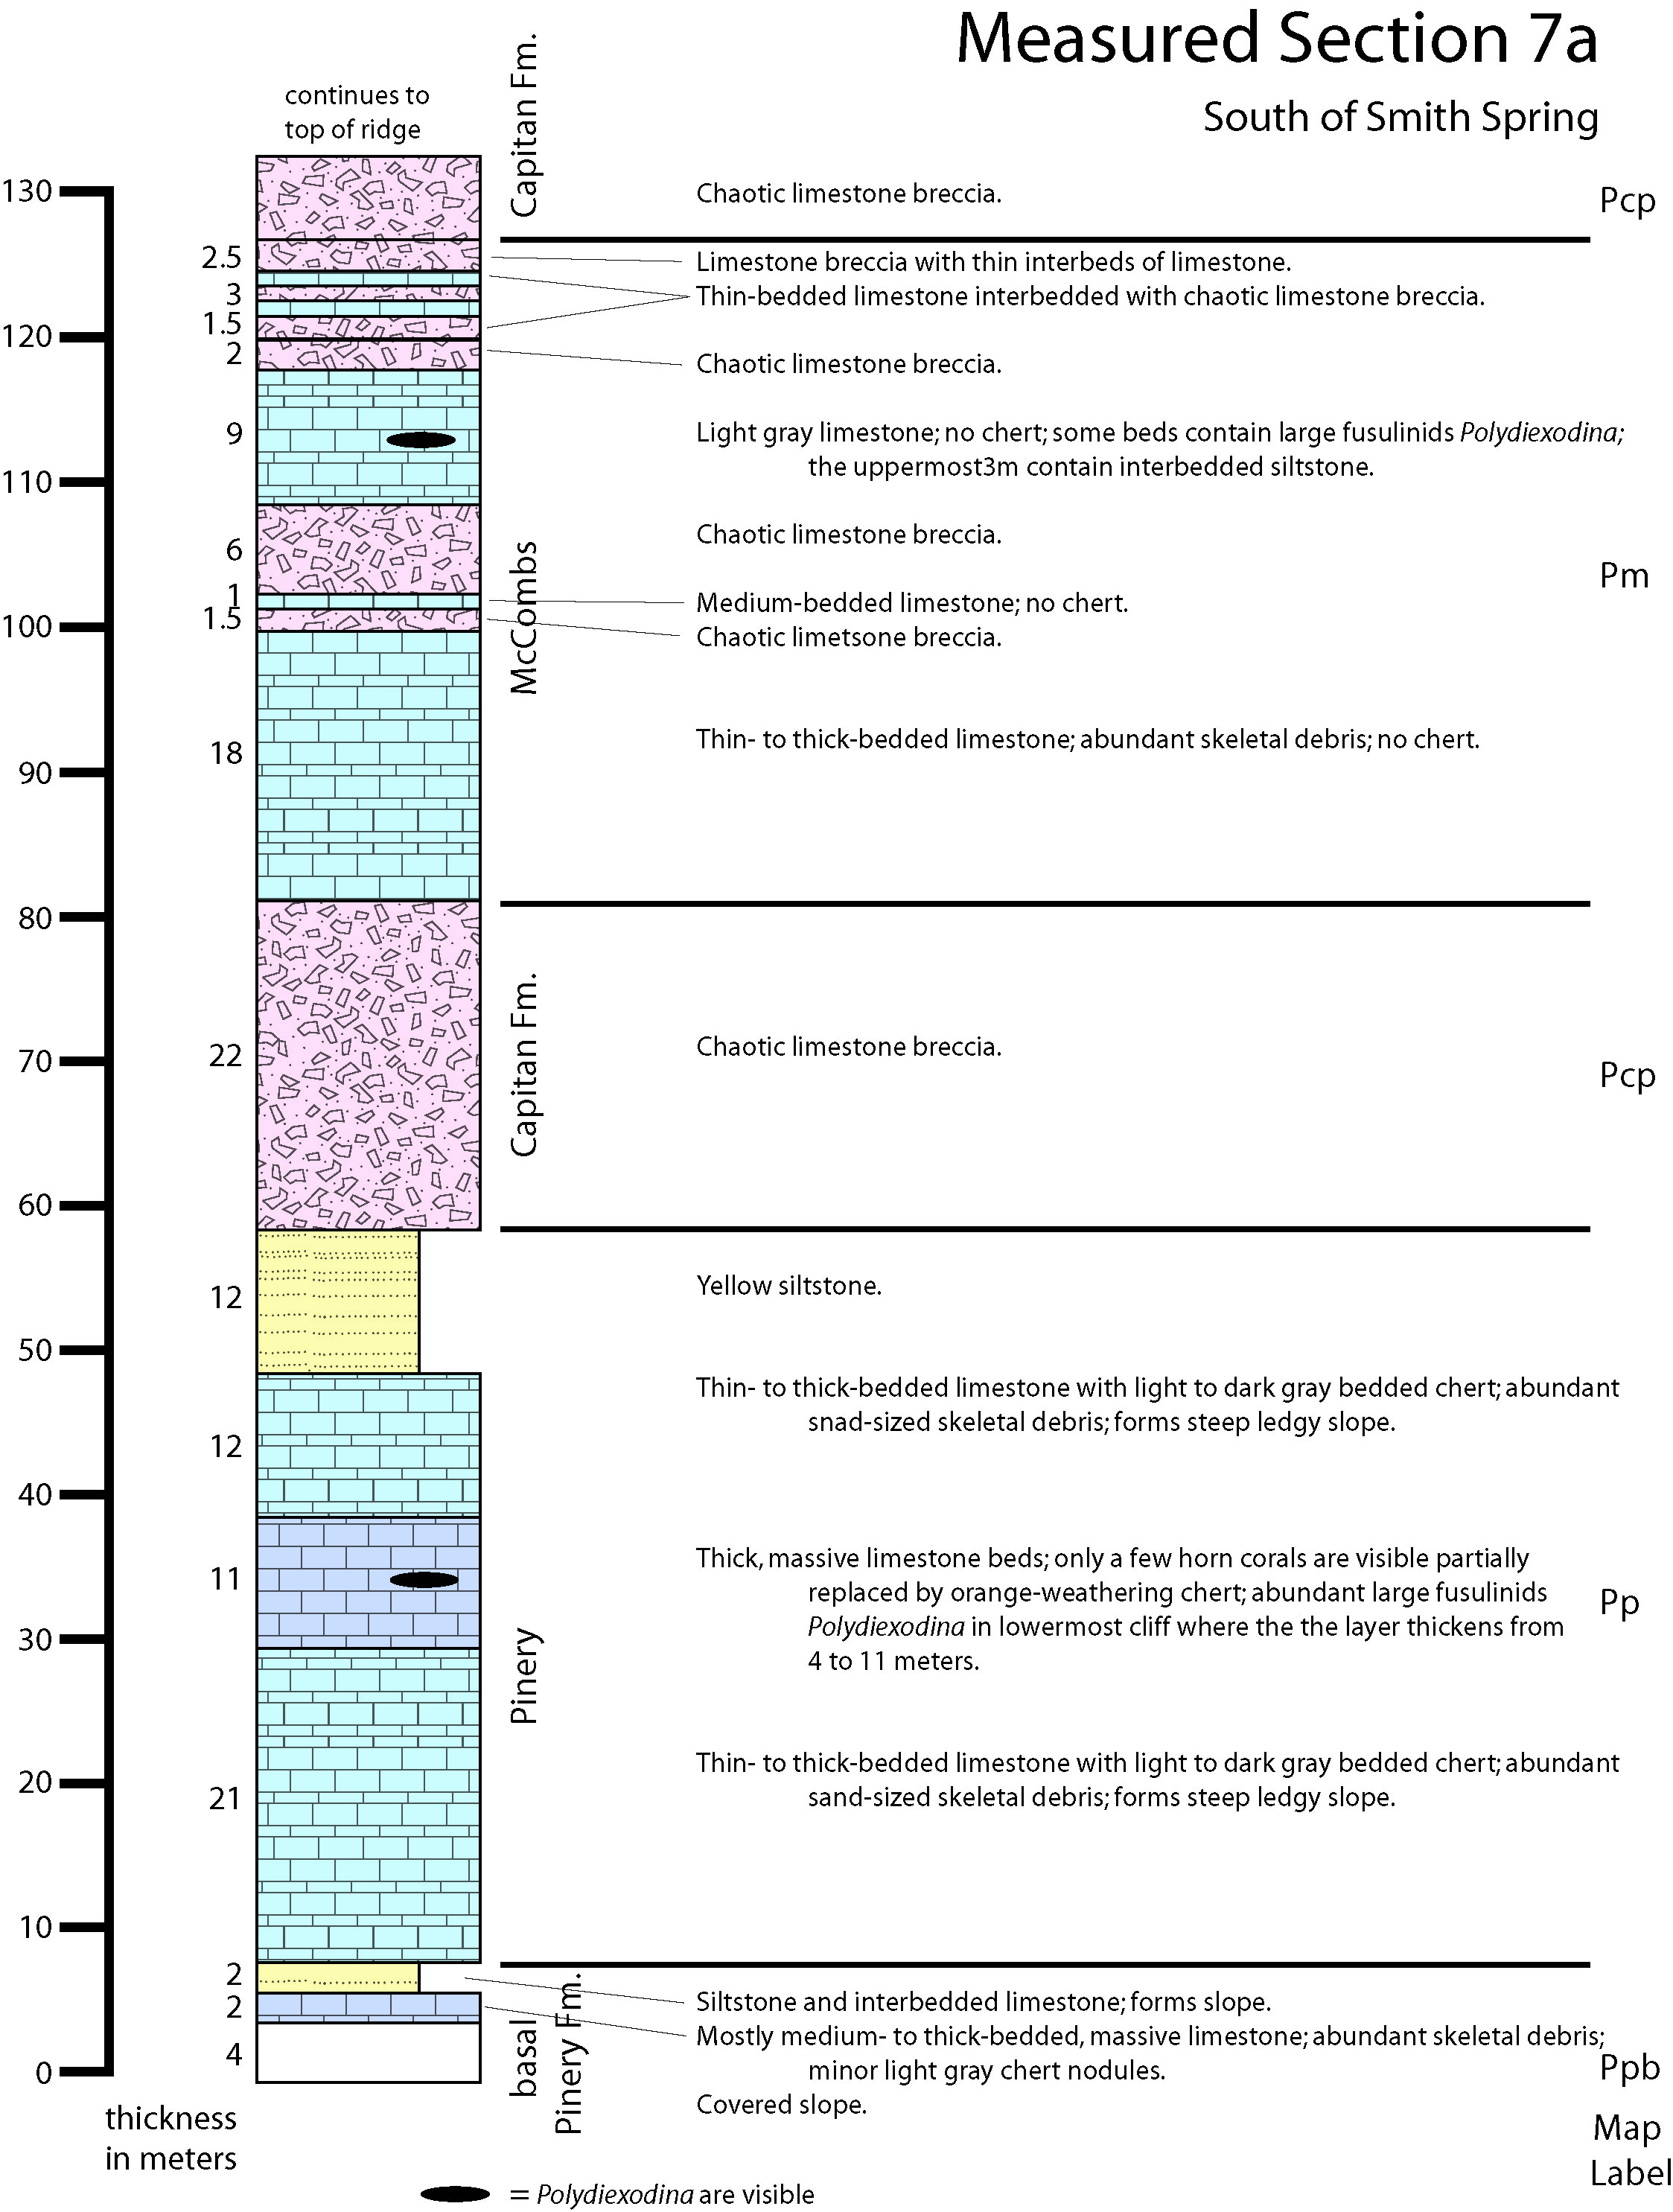
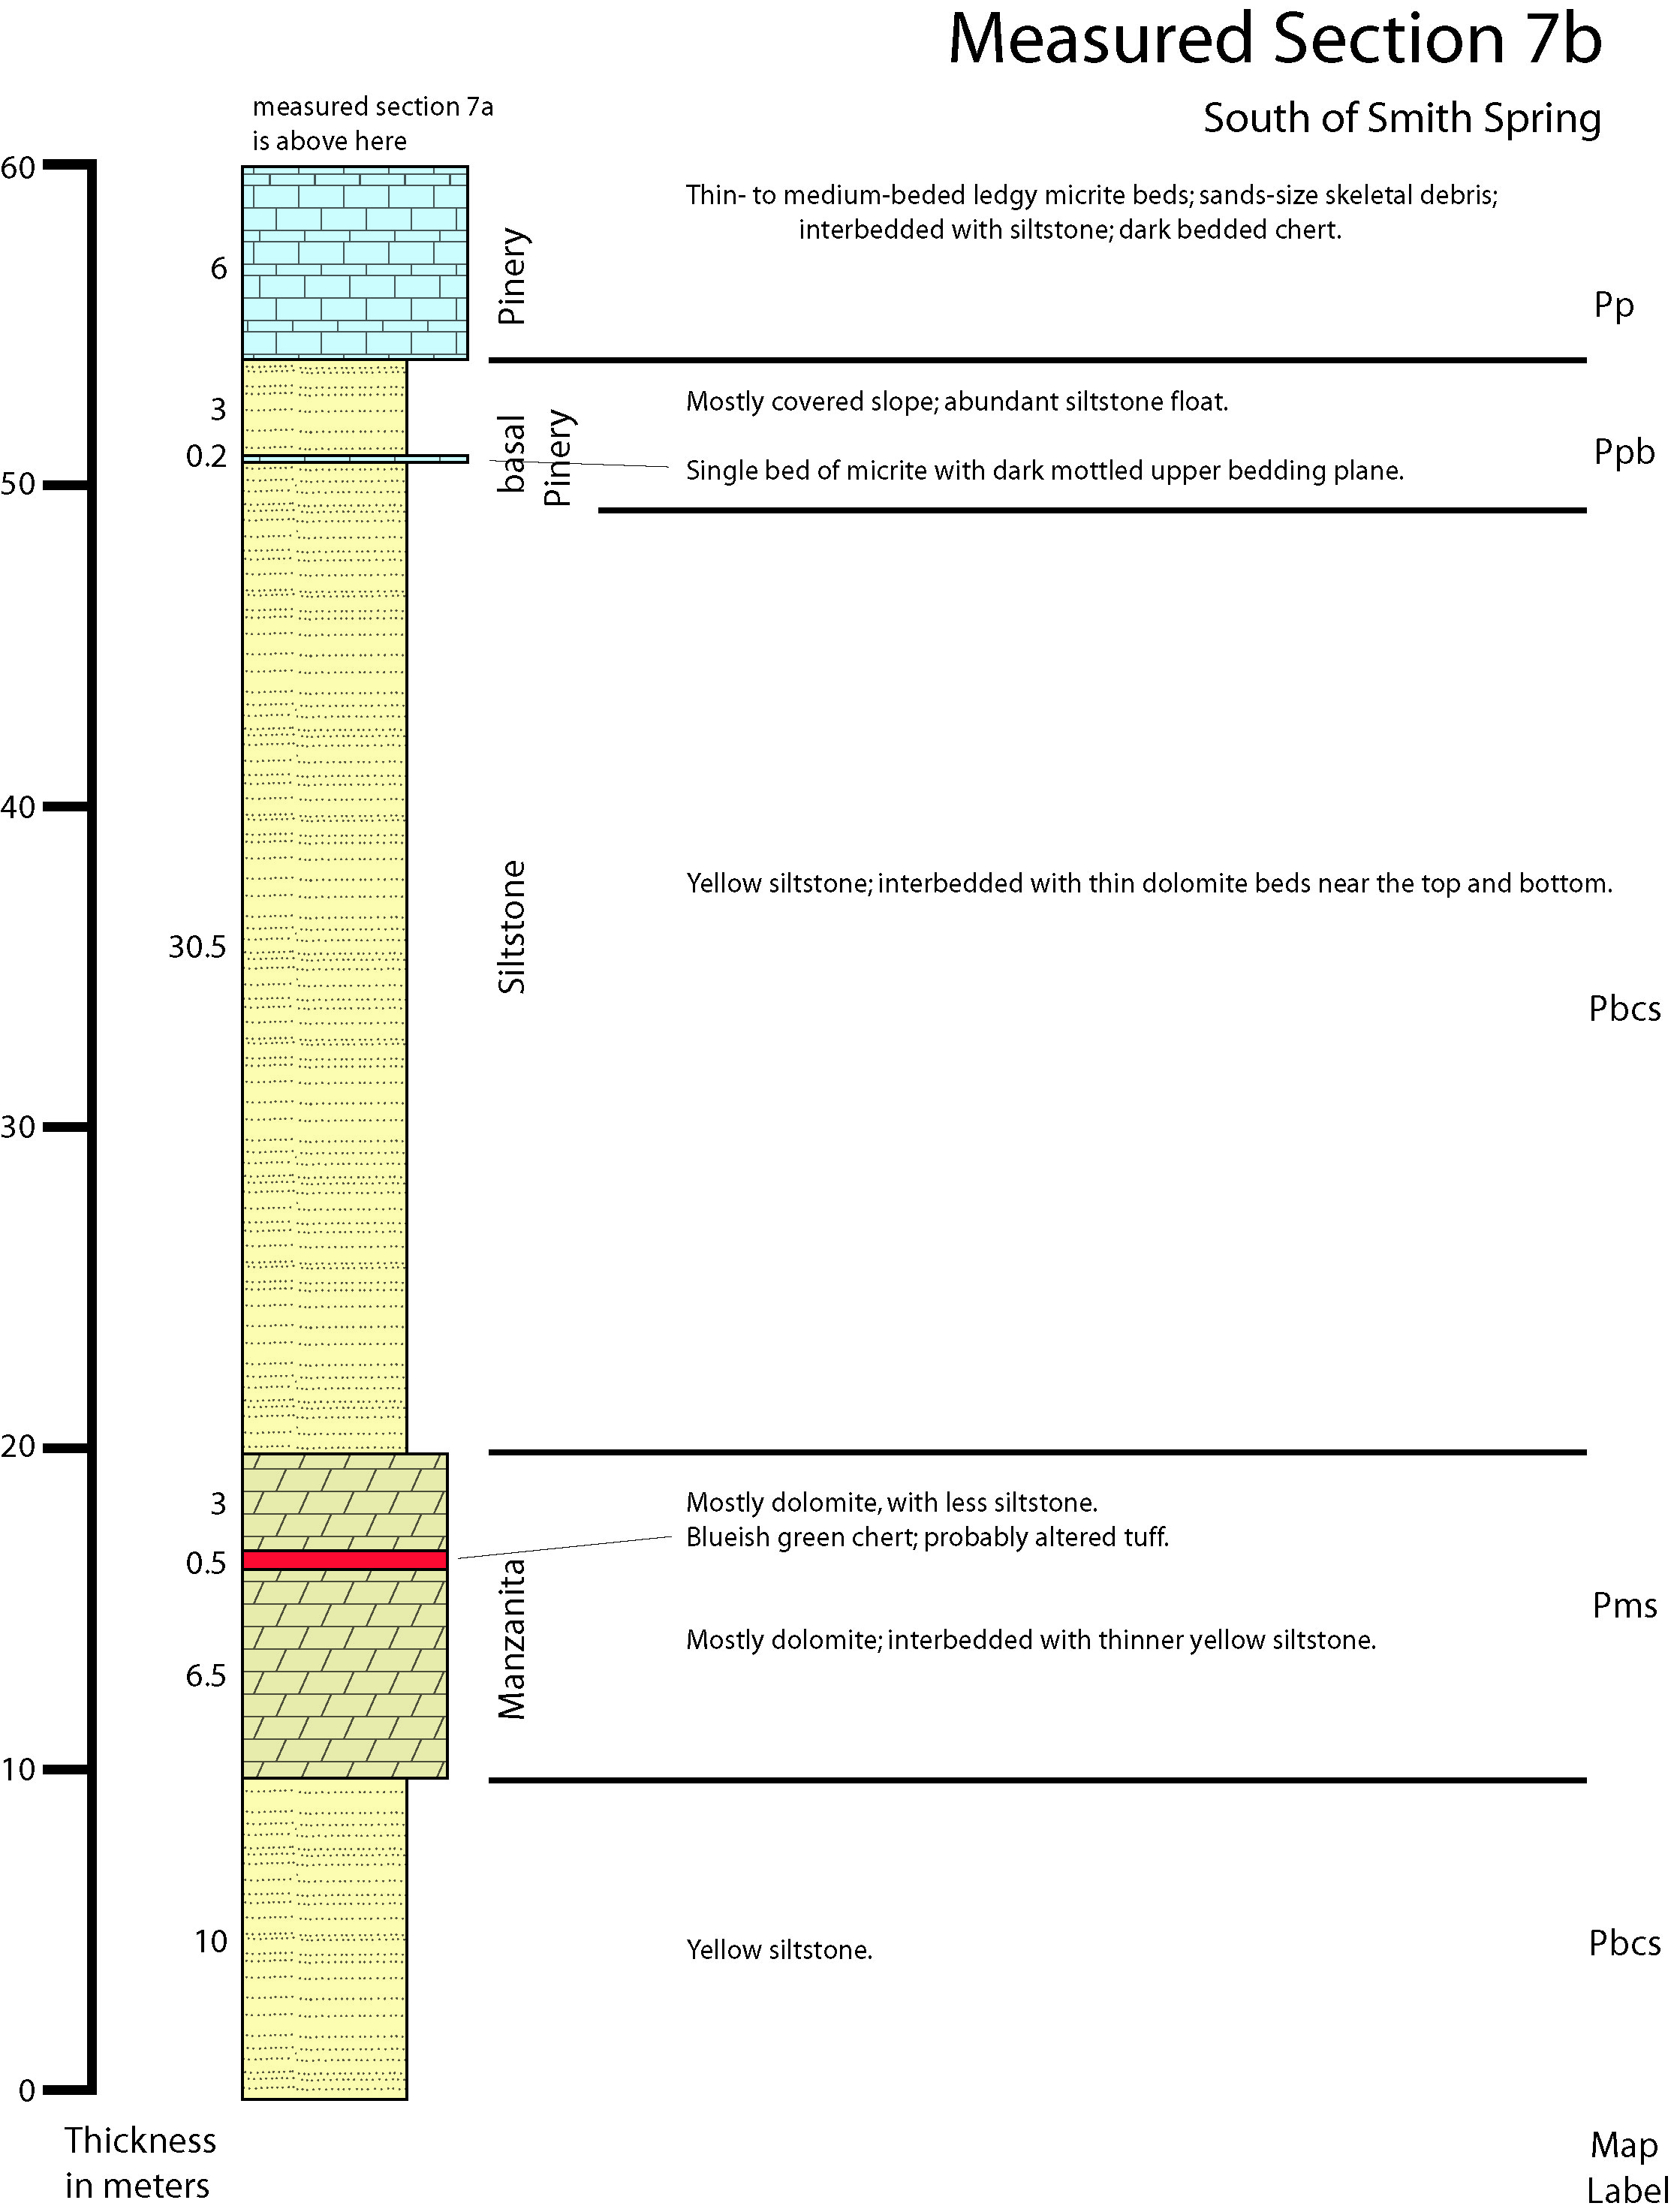
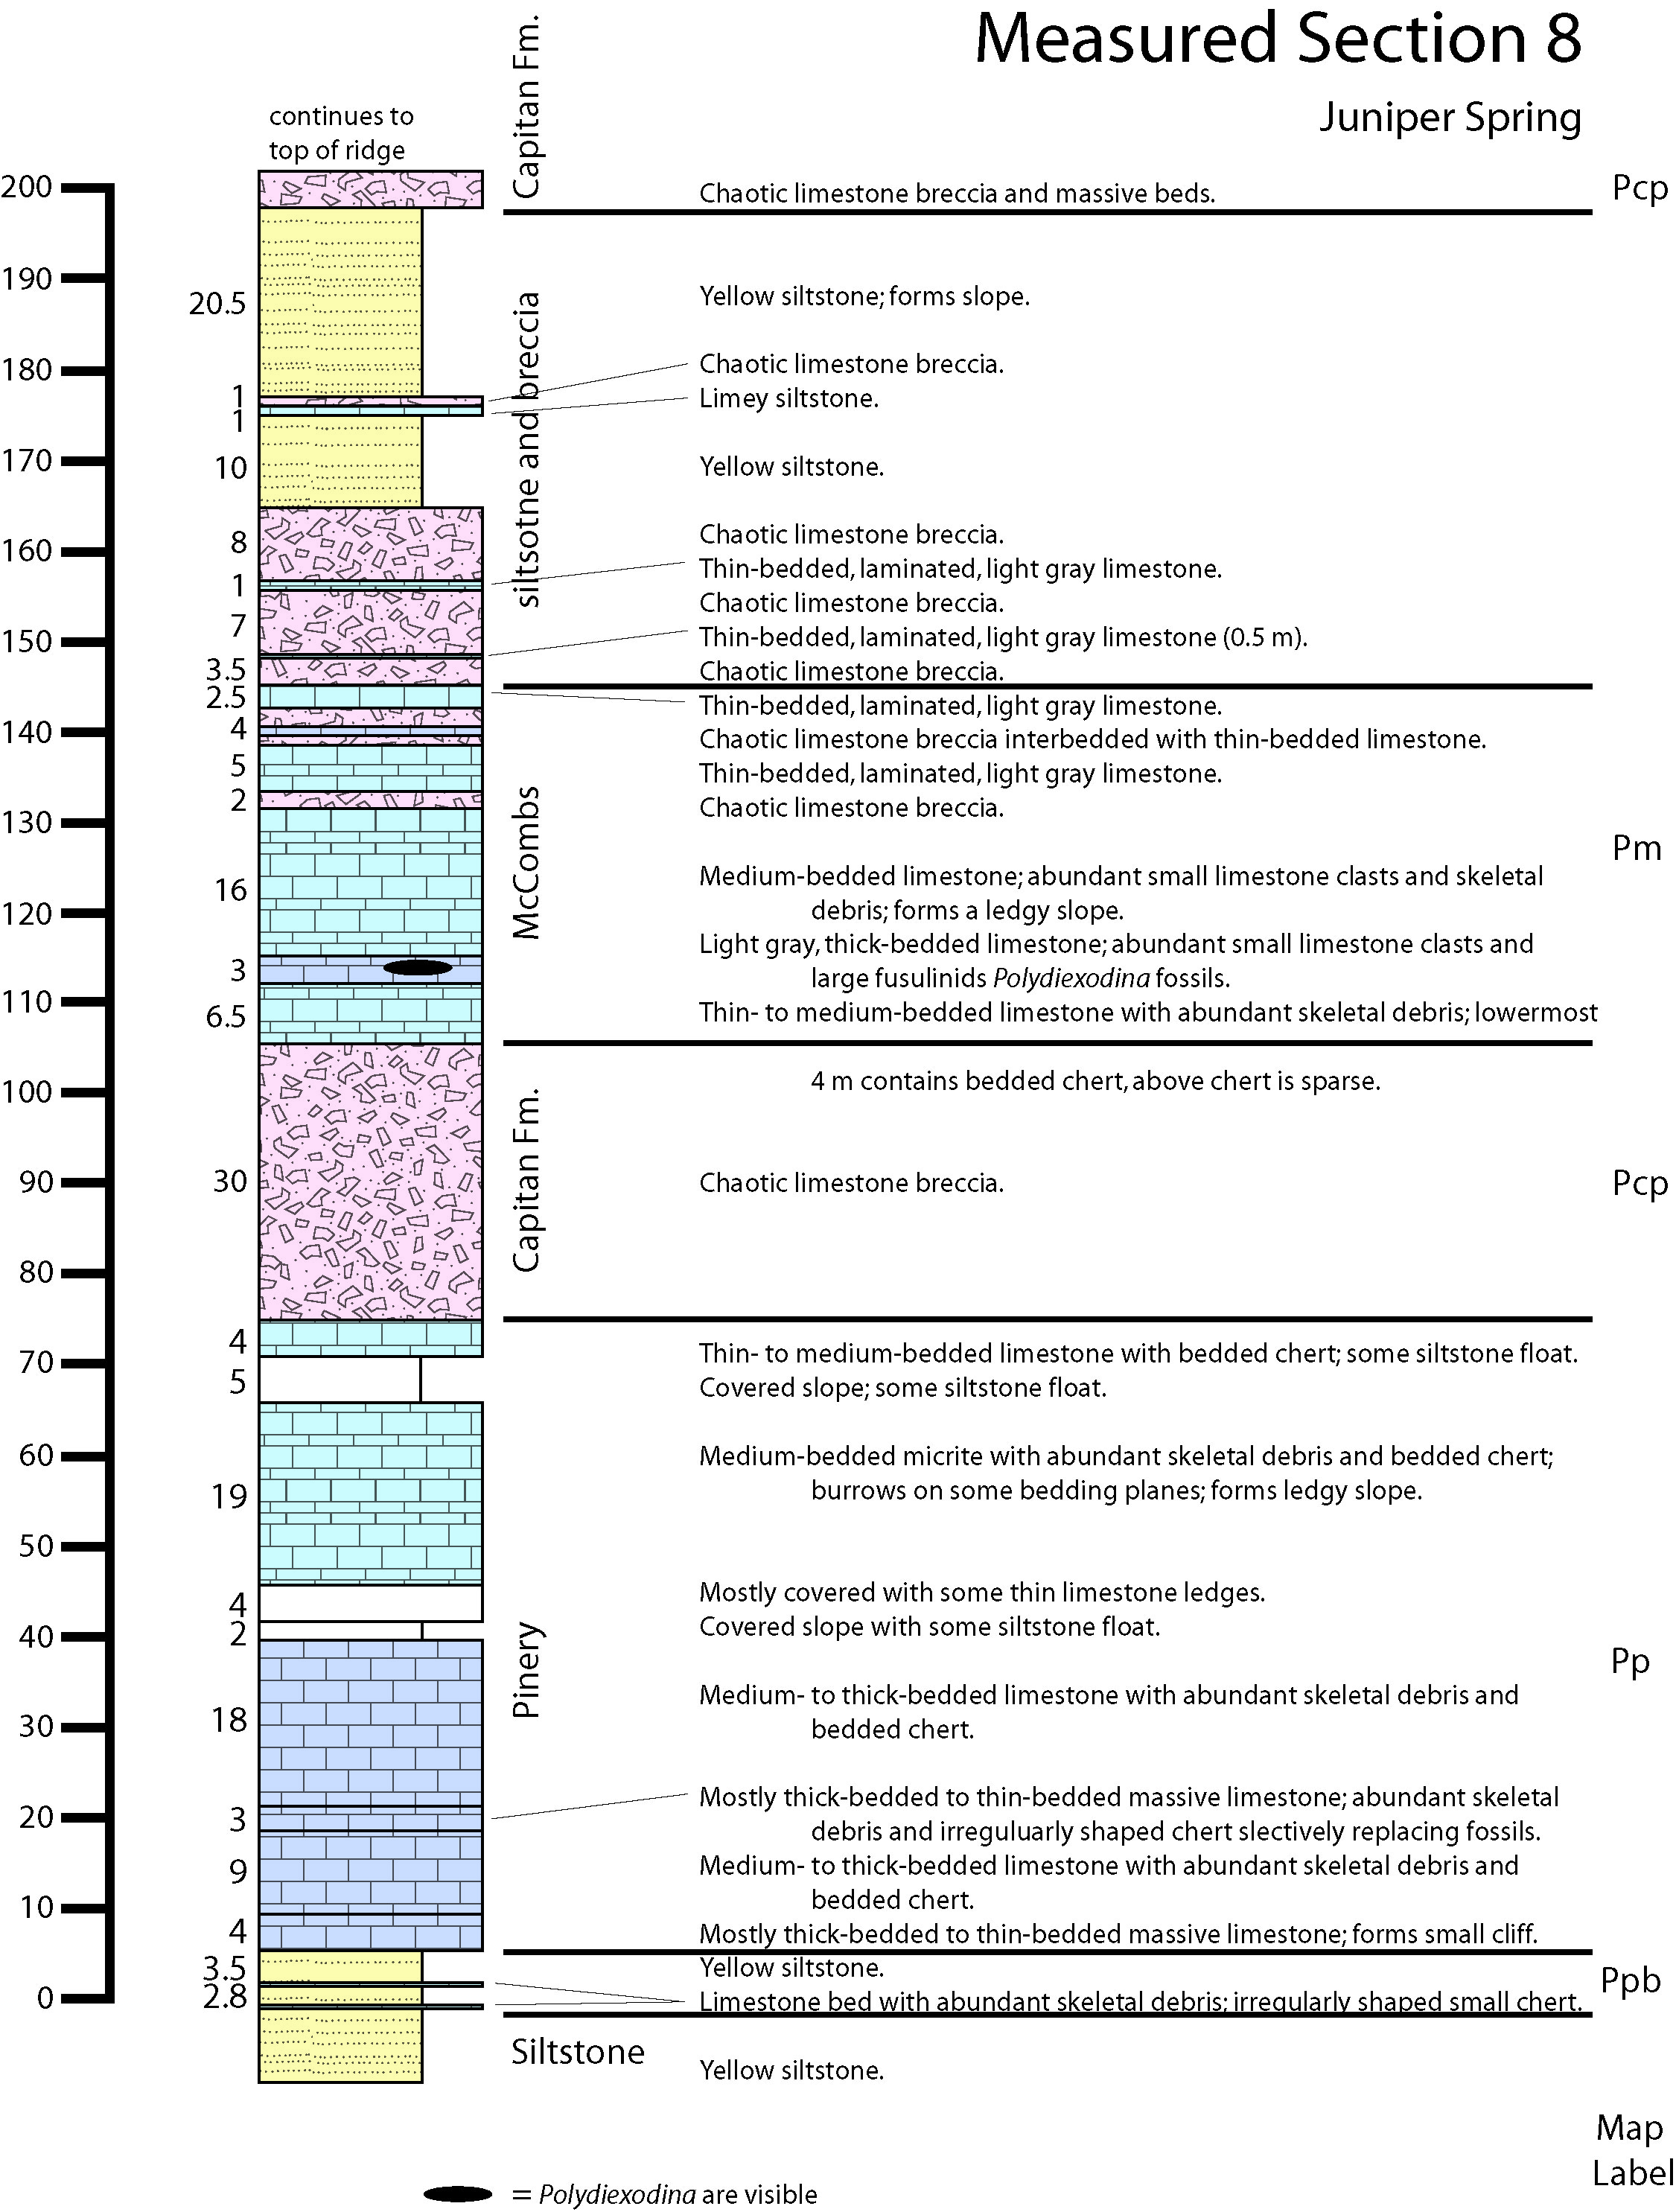
OFR-610: Geologic Map of the Guadalupe Mountains National Park, Culberson and Hudspeth Counties, Texas
We are a research and service division of:
Steven J. Skotnicki and Ann D. Knight
2021
(last revised: 4-April-2022)

The Guadalupe Peak 7.5’ quadrangle covers the southernmost exposures of the Guadalupe Mountains, in western Texas. Elevations in the quadrangle range from 4,830 feet above sea level in the southeast corner of the map to 8,751 feet at Guadalupe Peak, the highest elevation in the State of Texas. Except for the southeast portion of the map, most of the land resides within the Guadalupe Mountains National Park. U.S. Highways 62/180 cut through the very southeast edge of the Park, connecting El Paso approximately 100 miles to the west with Carlsbad, New Mexico, approximately 50 miles to the northeast. A 70-mile drive west and south along Route 137 from Carlsbad provides the only vehicle access to the high country into Upper Dog Canyon, near the northern boundary of the map.
In the southwest portion of the map, Pine Spring Canyon is the gateway to the Guadalupe Mountains National Park. The canyon contains the National Park Visitor Center and Pine Spring Campground, and is the trailhead for several of the Park’s extensive and well-maintained trails. U.S. Highways 62/180 reach their highest elevation at the 5,424-foot-high divide located approximately 3,000 feet directly south of the Visitor Center. This divide has been a nexus for travelers for hundreds and possibly for thousands of years, the nearby thousand-foot-high spire of El Capitan providing a landmark visible from far away.
The rocks of the Guadalupe Mountains are some of the most studied rocks on Earth and much has been written about their geologic history (see the webpage of the National Park Service for a good introduction and their Geodiversity Atlas for links to more geologic resources: https://www.nps.gov/articles/nps-geodiversity-atlas-guadalupe-mountains-national-park-texas.htm. Also, Peter Scholle created a virtual tour that provides a great introduction to the geologic history of the Guadalupe Mountains with numerous illustrations and referenced sources for further reading: /tour/federal/parks/PermianReef. The current report does not attempt to reproduce or assimilate this large body of research. Instead, this report simply adds some new observations gleaned during the recent geologic mapping of the area and relates them to a small selection of some the previous work that has been done. This study also discusses some of the challenges that remain.
The first portion of this study was carried out during 2015 and 2016, which involved detailed mapping of mostly the lower elevations in the Guadalupe Mountains National Park from McKittrick Canyon in the northeast to the even lower elevations west and southwest of Guadalupe Pass. The second portion of the field work was performed in 2019, which mostly involved detailed mapping of the higher elevations. Some areas immediately marginal to the Guadalupe Peak 7.5’ quadrangle are also discussed here, but discussion of those areas further removed (such as the faulted areas southwest of Guadalupe Pass) are differed until those areas have been more thoroughly studied.
During the field work, sustained 20-30 mph winds, often with gusts exceeding 50 mph, were a constant companion. Because of the ubiquity of sharp, spiny Agave Lechugilla on the landscape, several times, after hiking to the top of a ridge only to be met by driving winds, the author turned around and went back down, rather than risk being blown over and impaled. Wearing a hat in these conditions is not possible.
Relevant photographs are included throughout the text of this report. More photos are included at the end of the text, after the references section, to help future researchers compare changes in the landscape.
$10.00
Buy
Now
The GIS Map Package contains mapping outside of the Guadalupe Mountains National Park boundary that are not displayed on the pdf of the map layout. Download the Map Package to obtain the mapping that is slightly outside of the park boundary.
Download
The GIS Map Package contains mapping outside of the Guadalupe Mountains National Park boundary that are not displayed on the pdf of the map layout. Download the Map Package to obtain the mapping that is slightly outside of the park boundary.
Open-file Reports are available as free downloads or on CD/DVD-ROM (see below). Note that these reports are subject to frequent revisions and may be unavailable when being modified. The Last Modified date listed here reflects when a file was last saved and may not be the date this report was last revised.
| File Name | Size | Last Modified |
|---|---|---|
| OFR-610_GuadalupeMountainsNP_GeoPDF.pdf | 71.58 MB | 04/11/2022 03:37:09 PM |
| OFR-610_GuadalupeMountainsNP_Report.pdf | 40.40 MB | 04/11/2022 03:38:51 PM |
| GIS Data: | ||
| OFR-610_GuadalupeMountainsNP.mpk | 123.91 MB | 04/11/2022 04:50:46 PM |
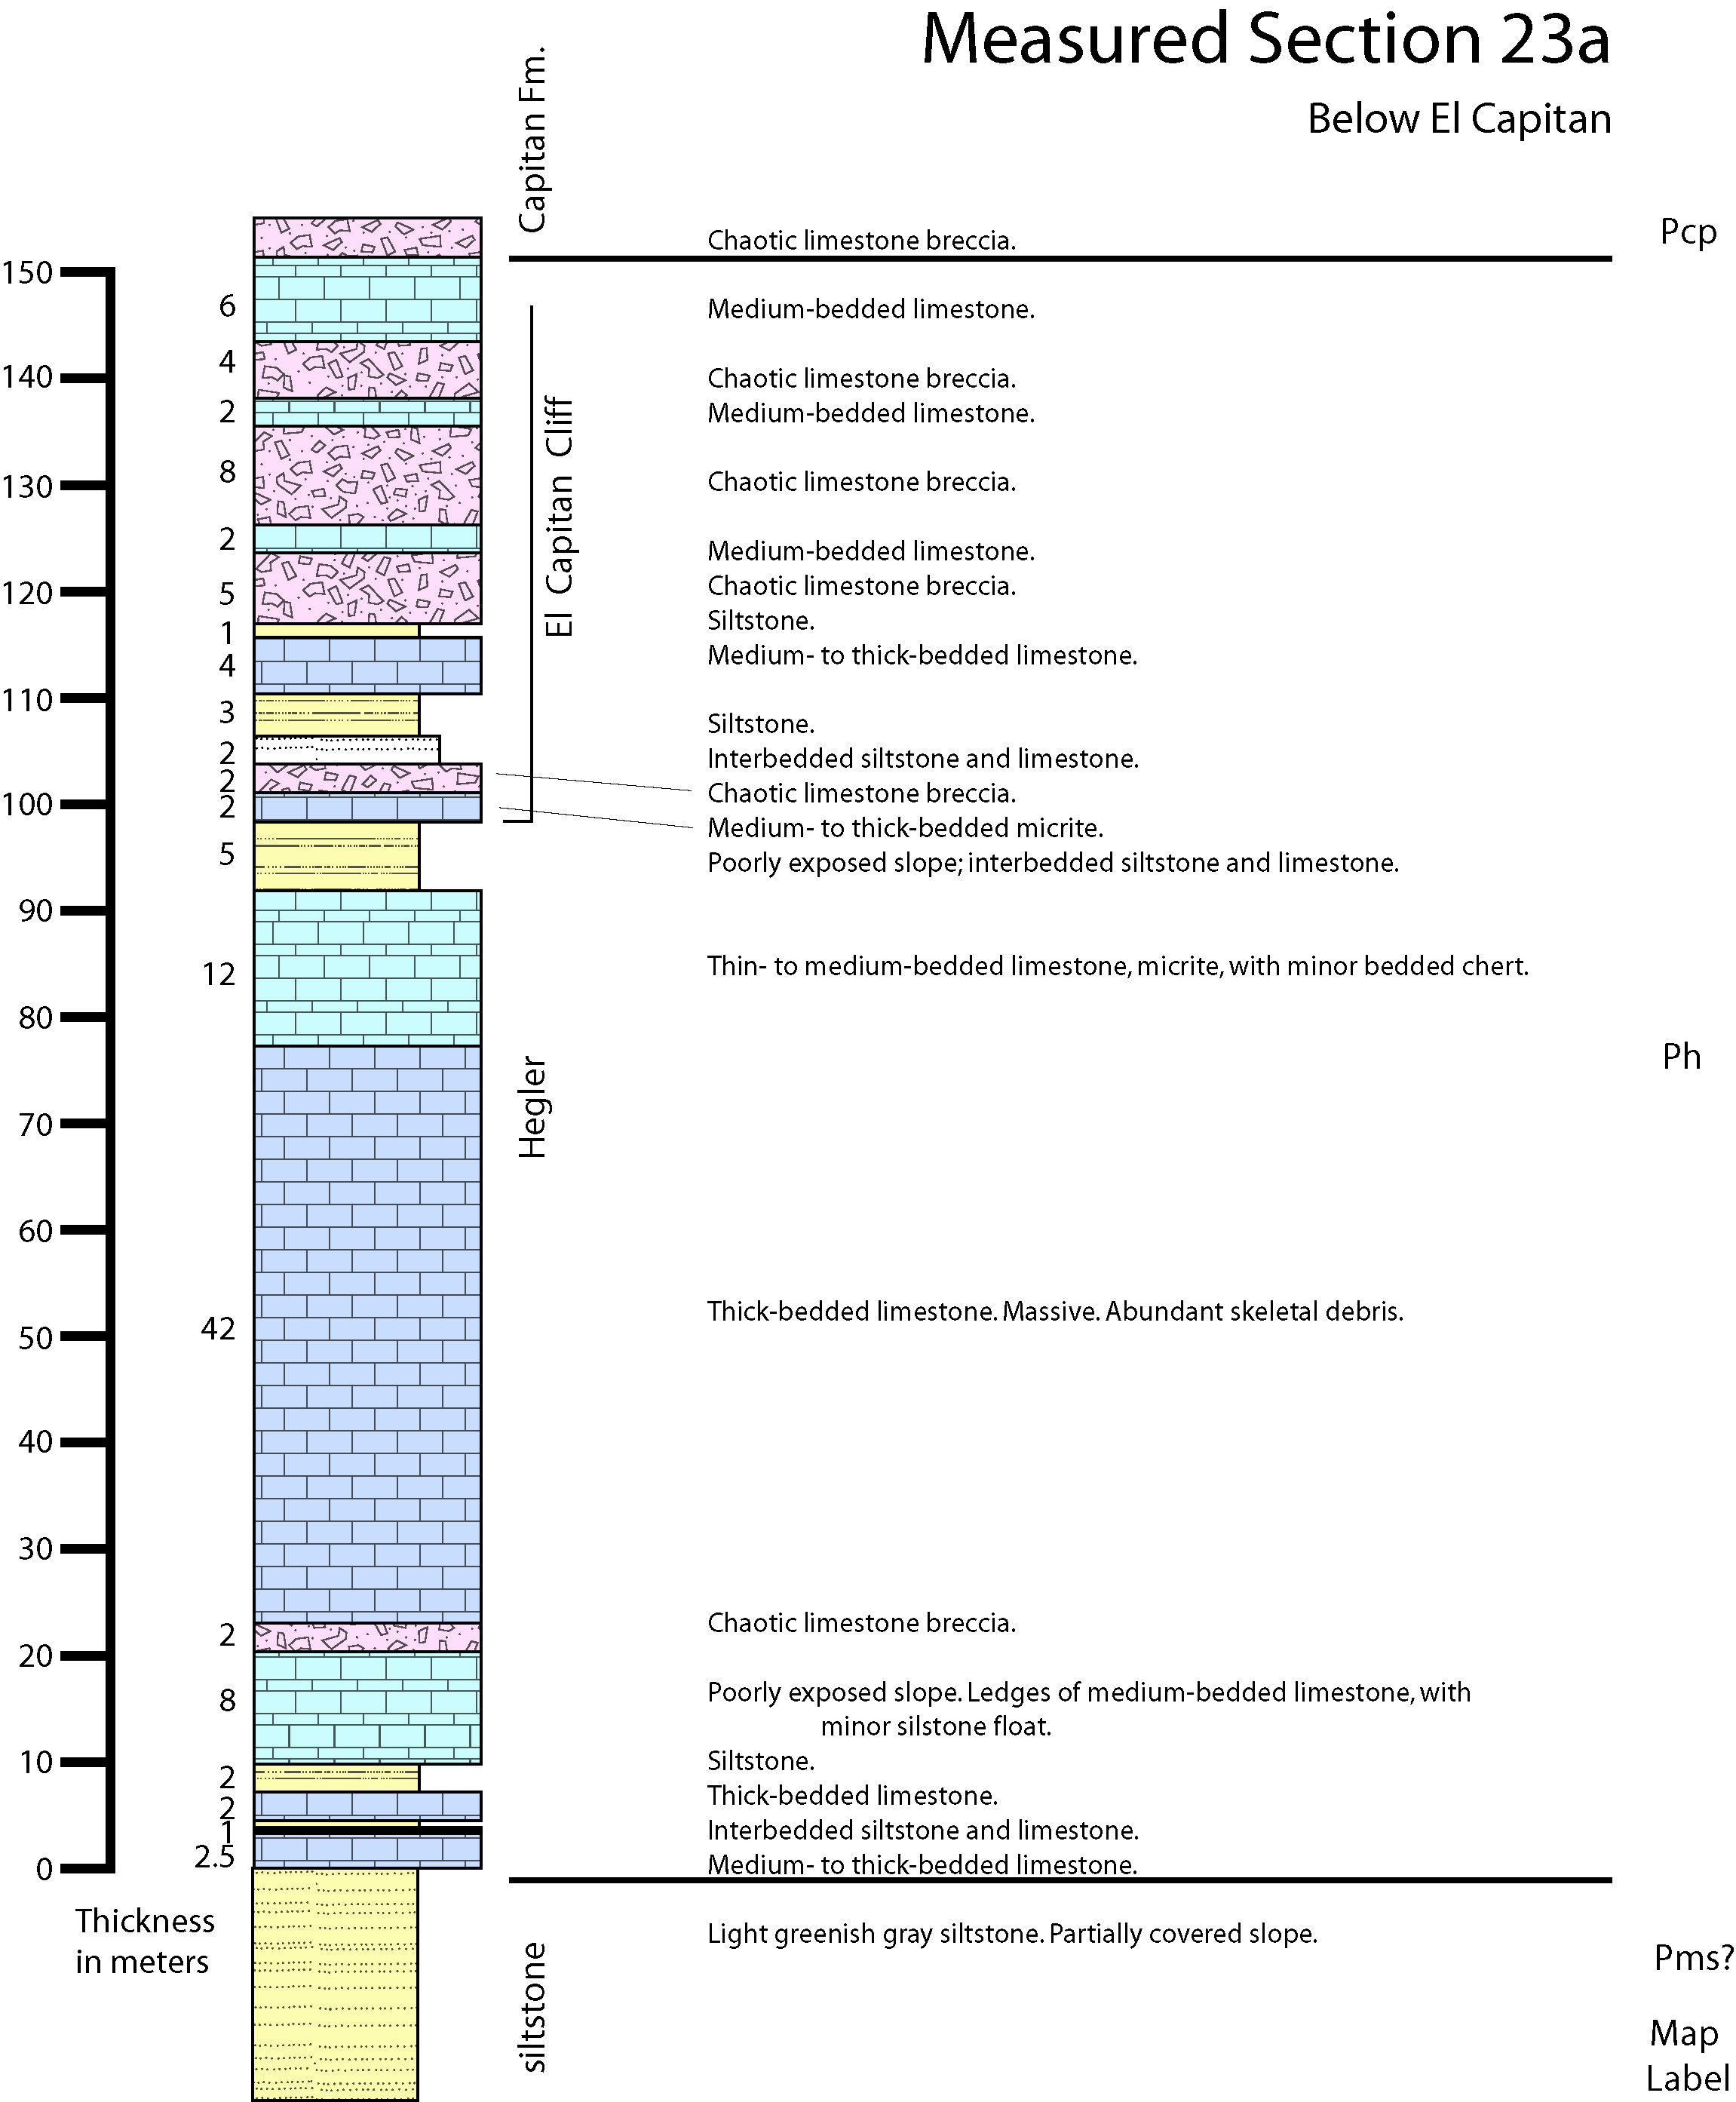
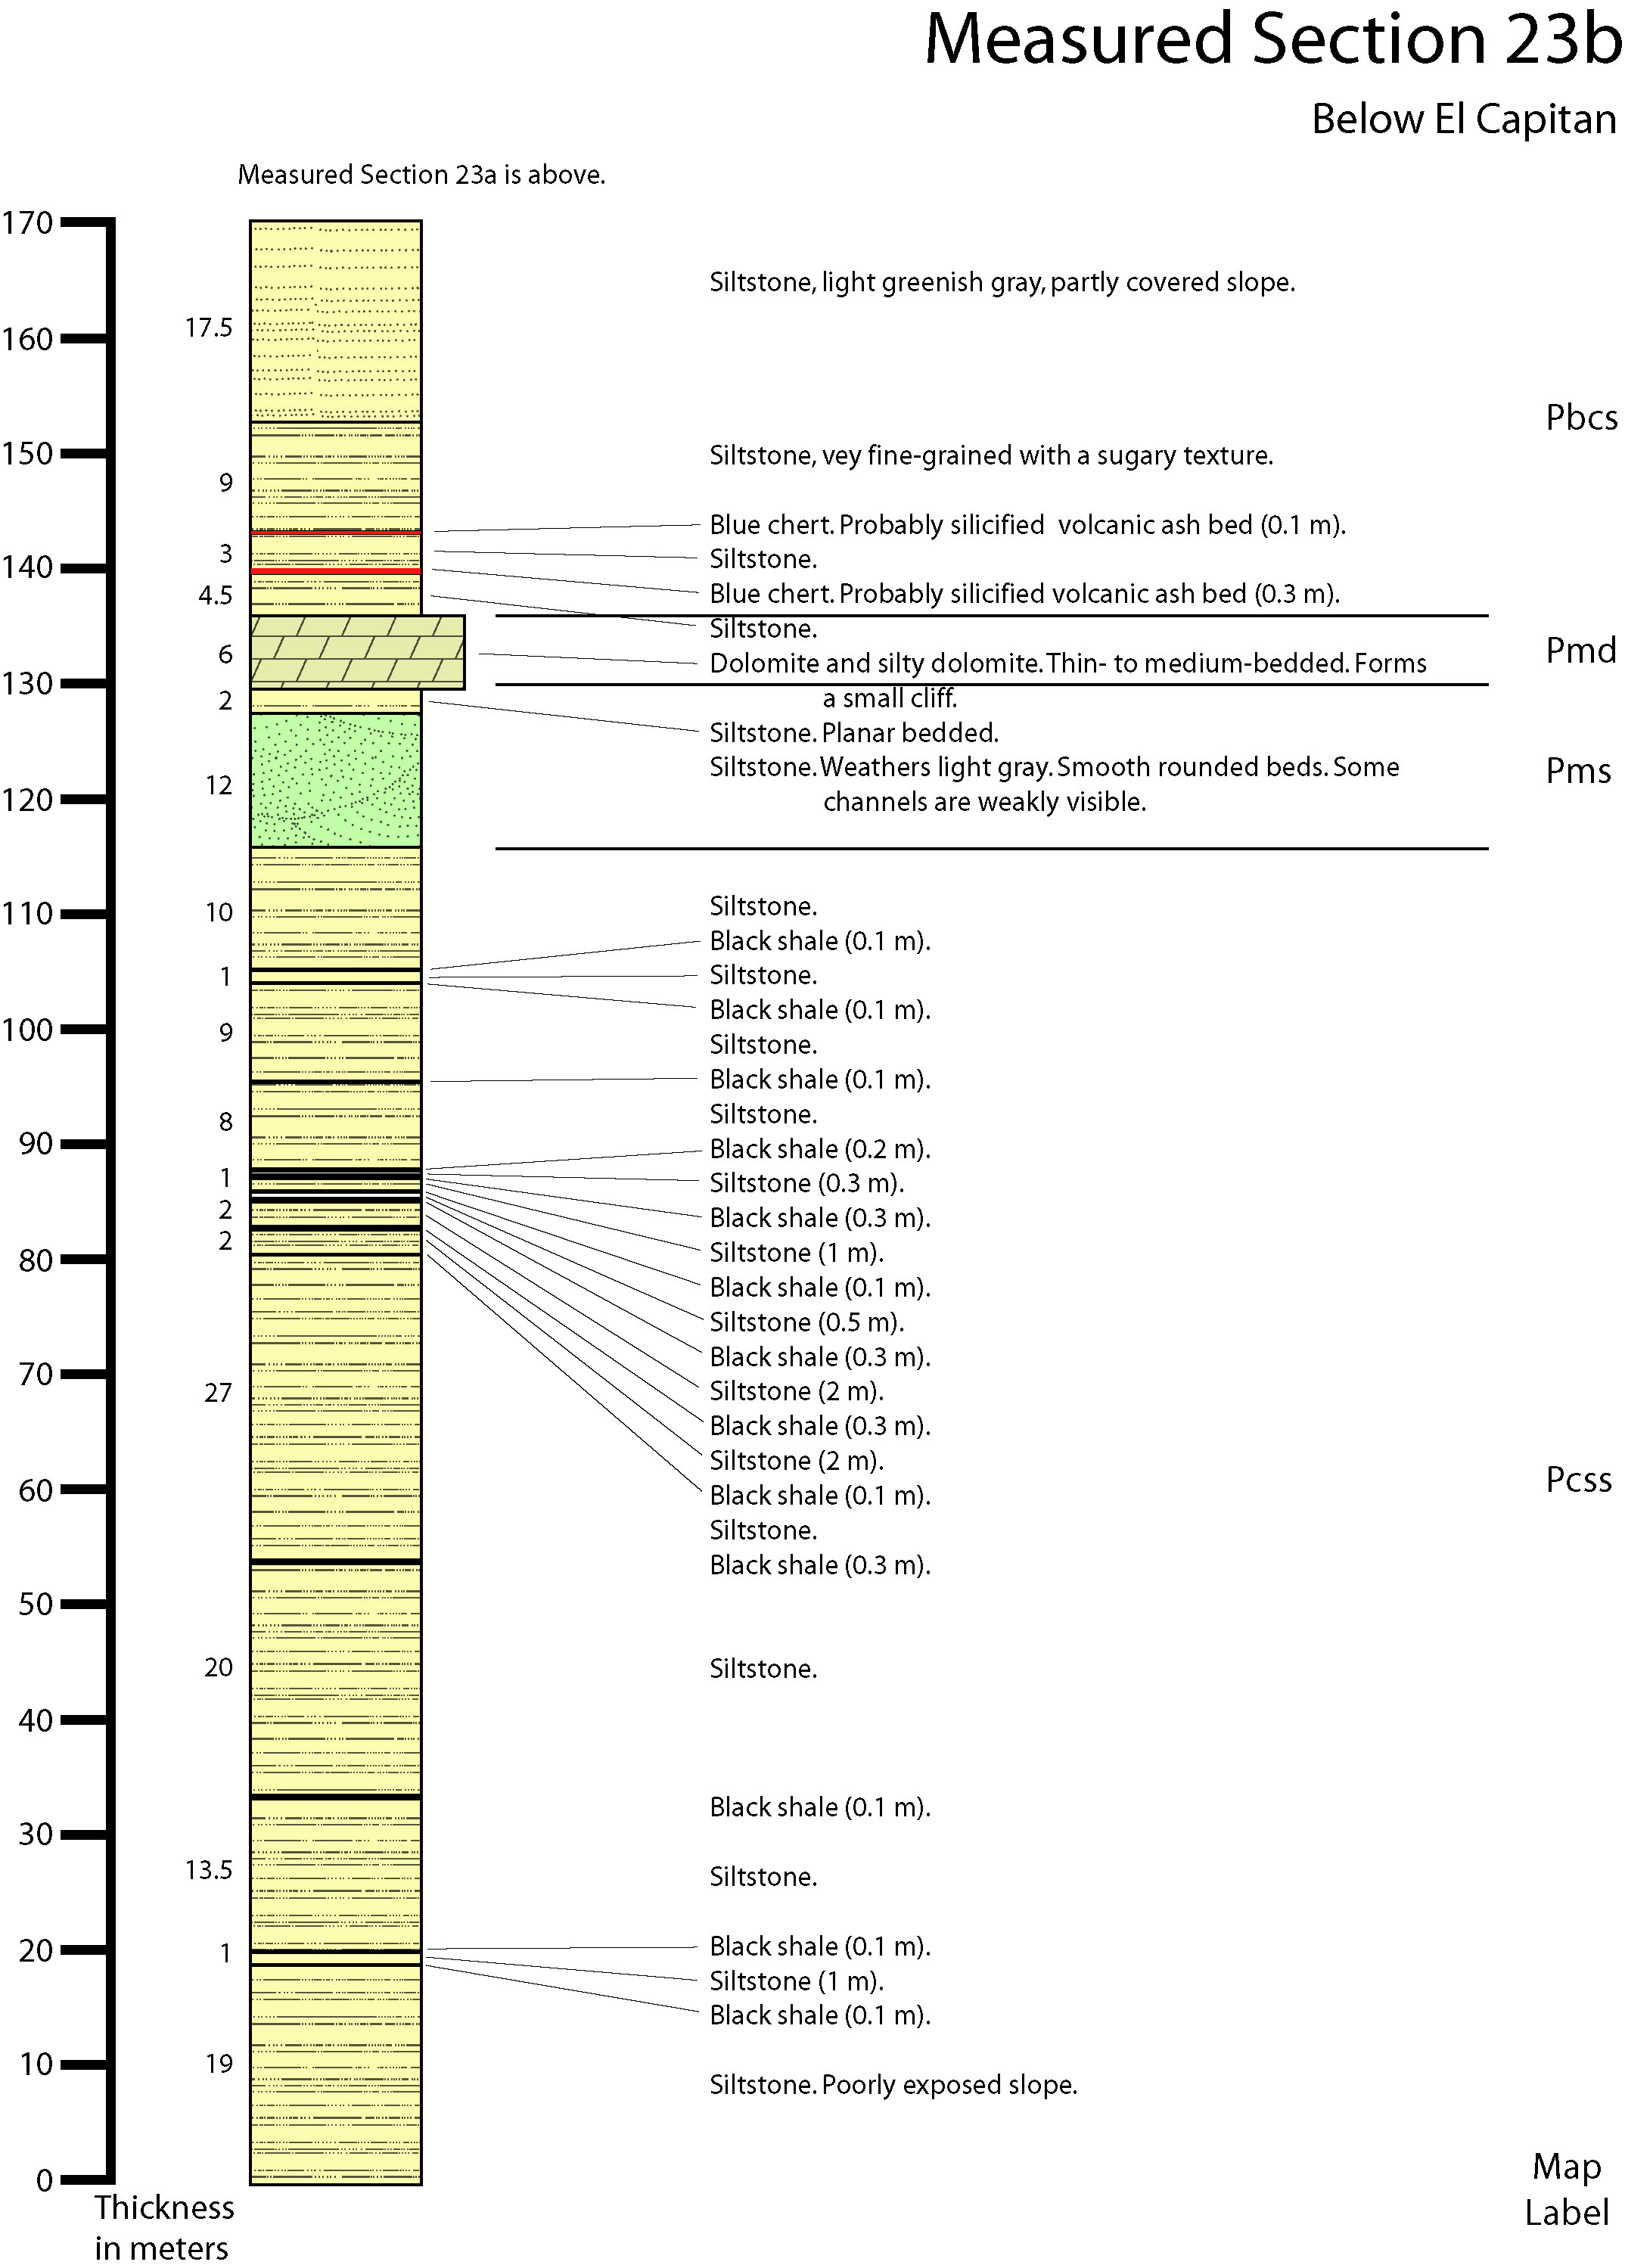
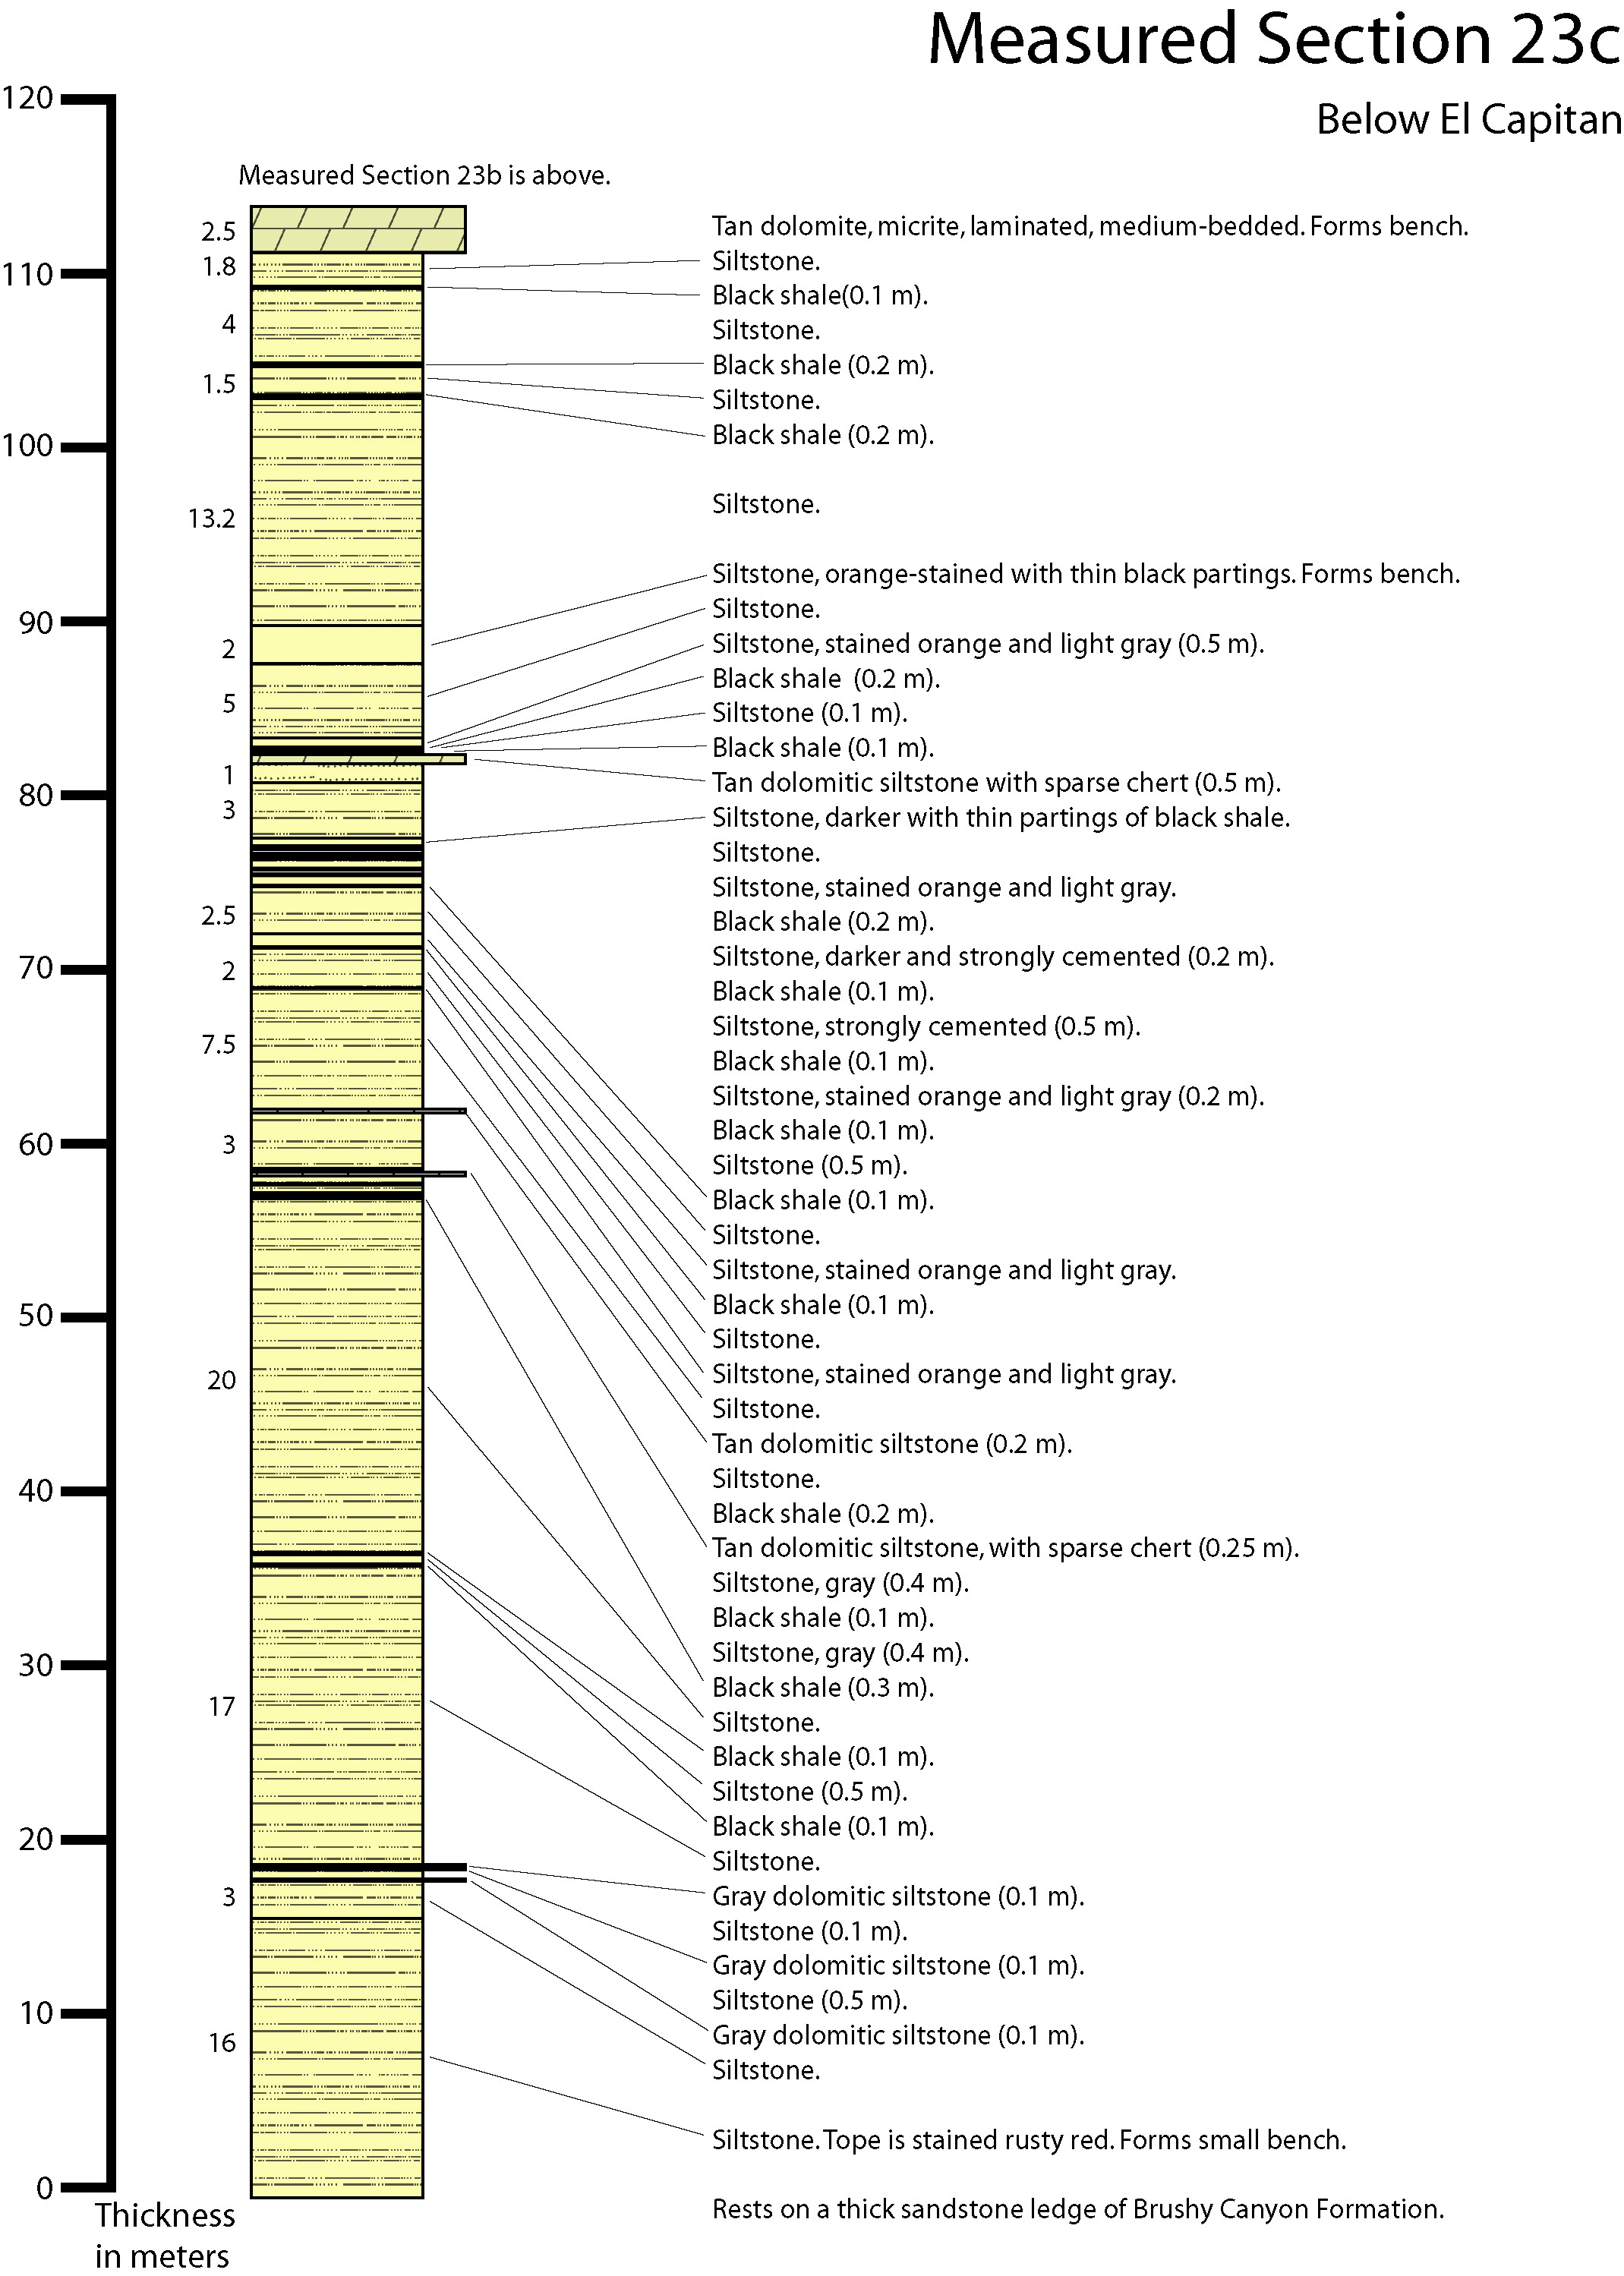
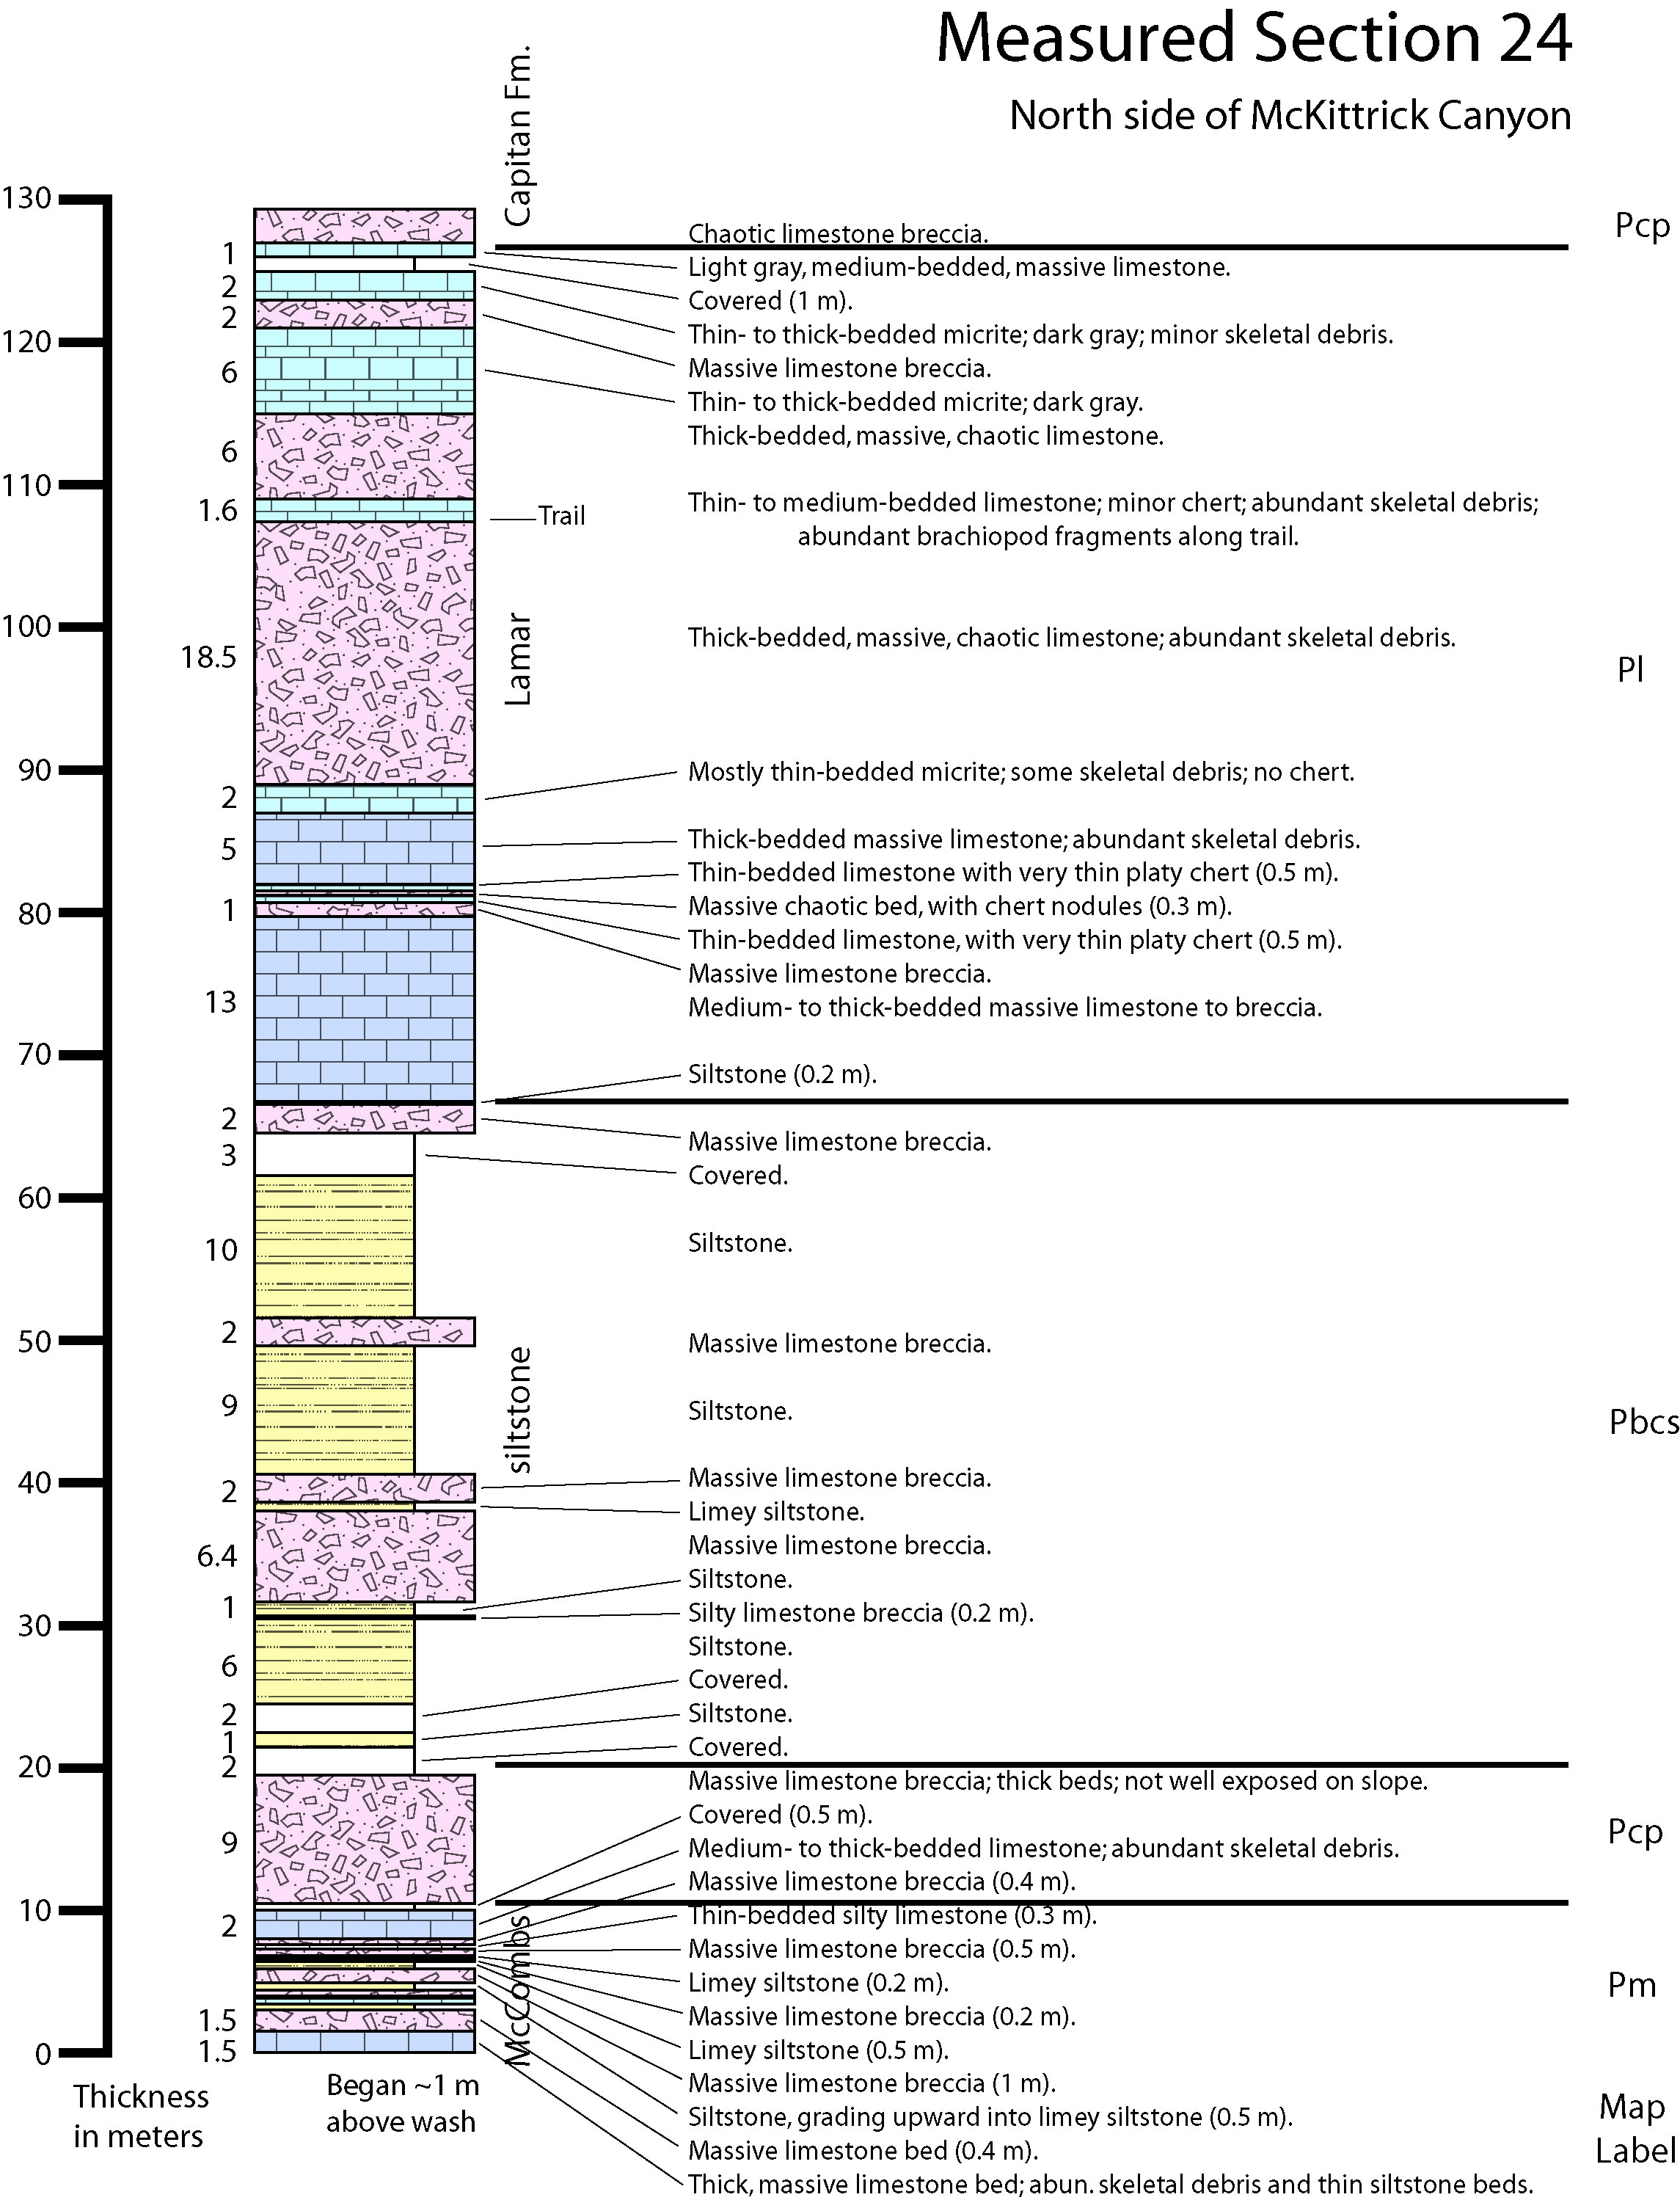
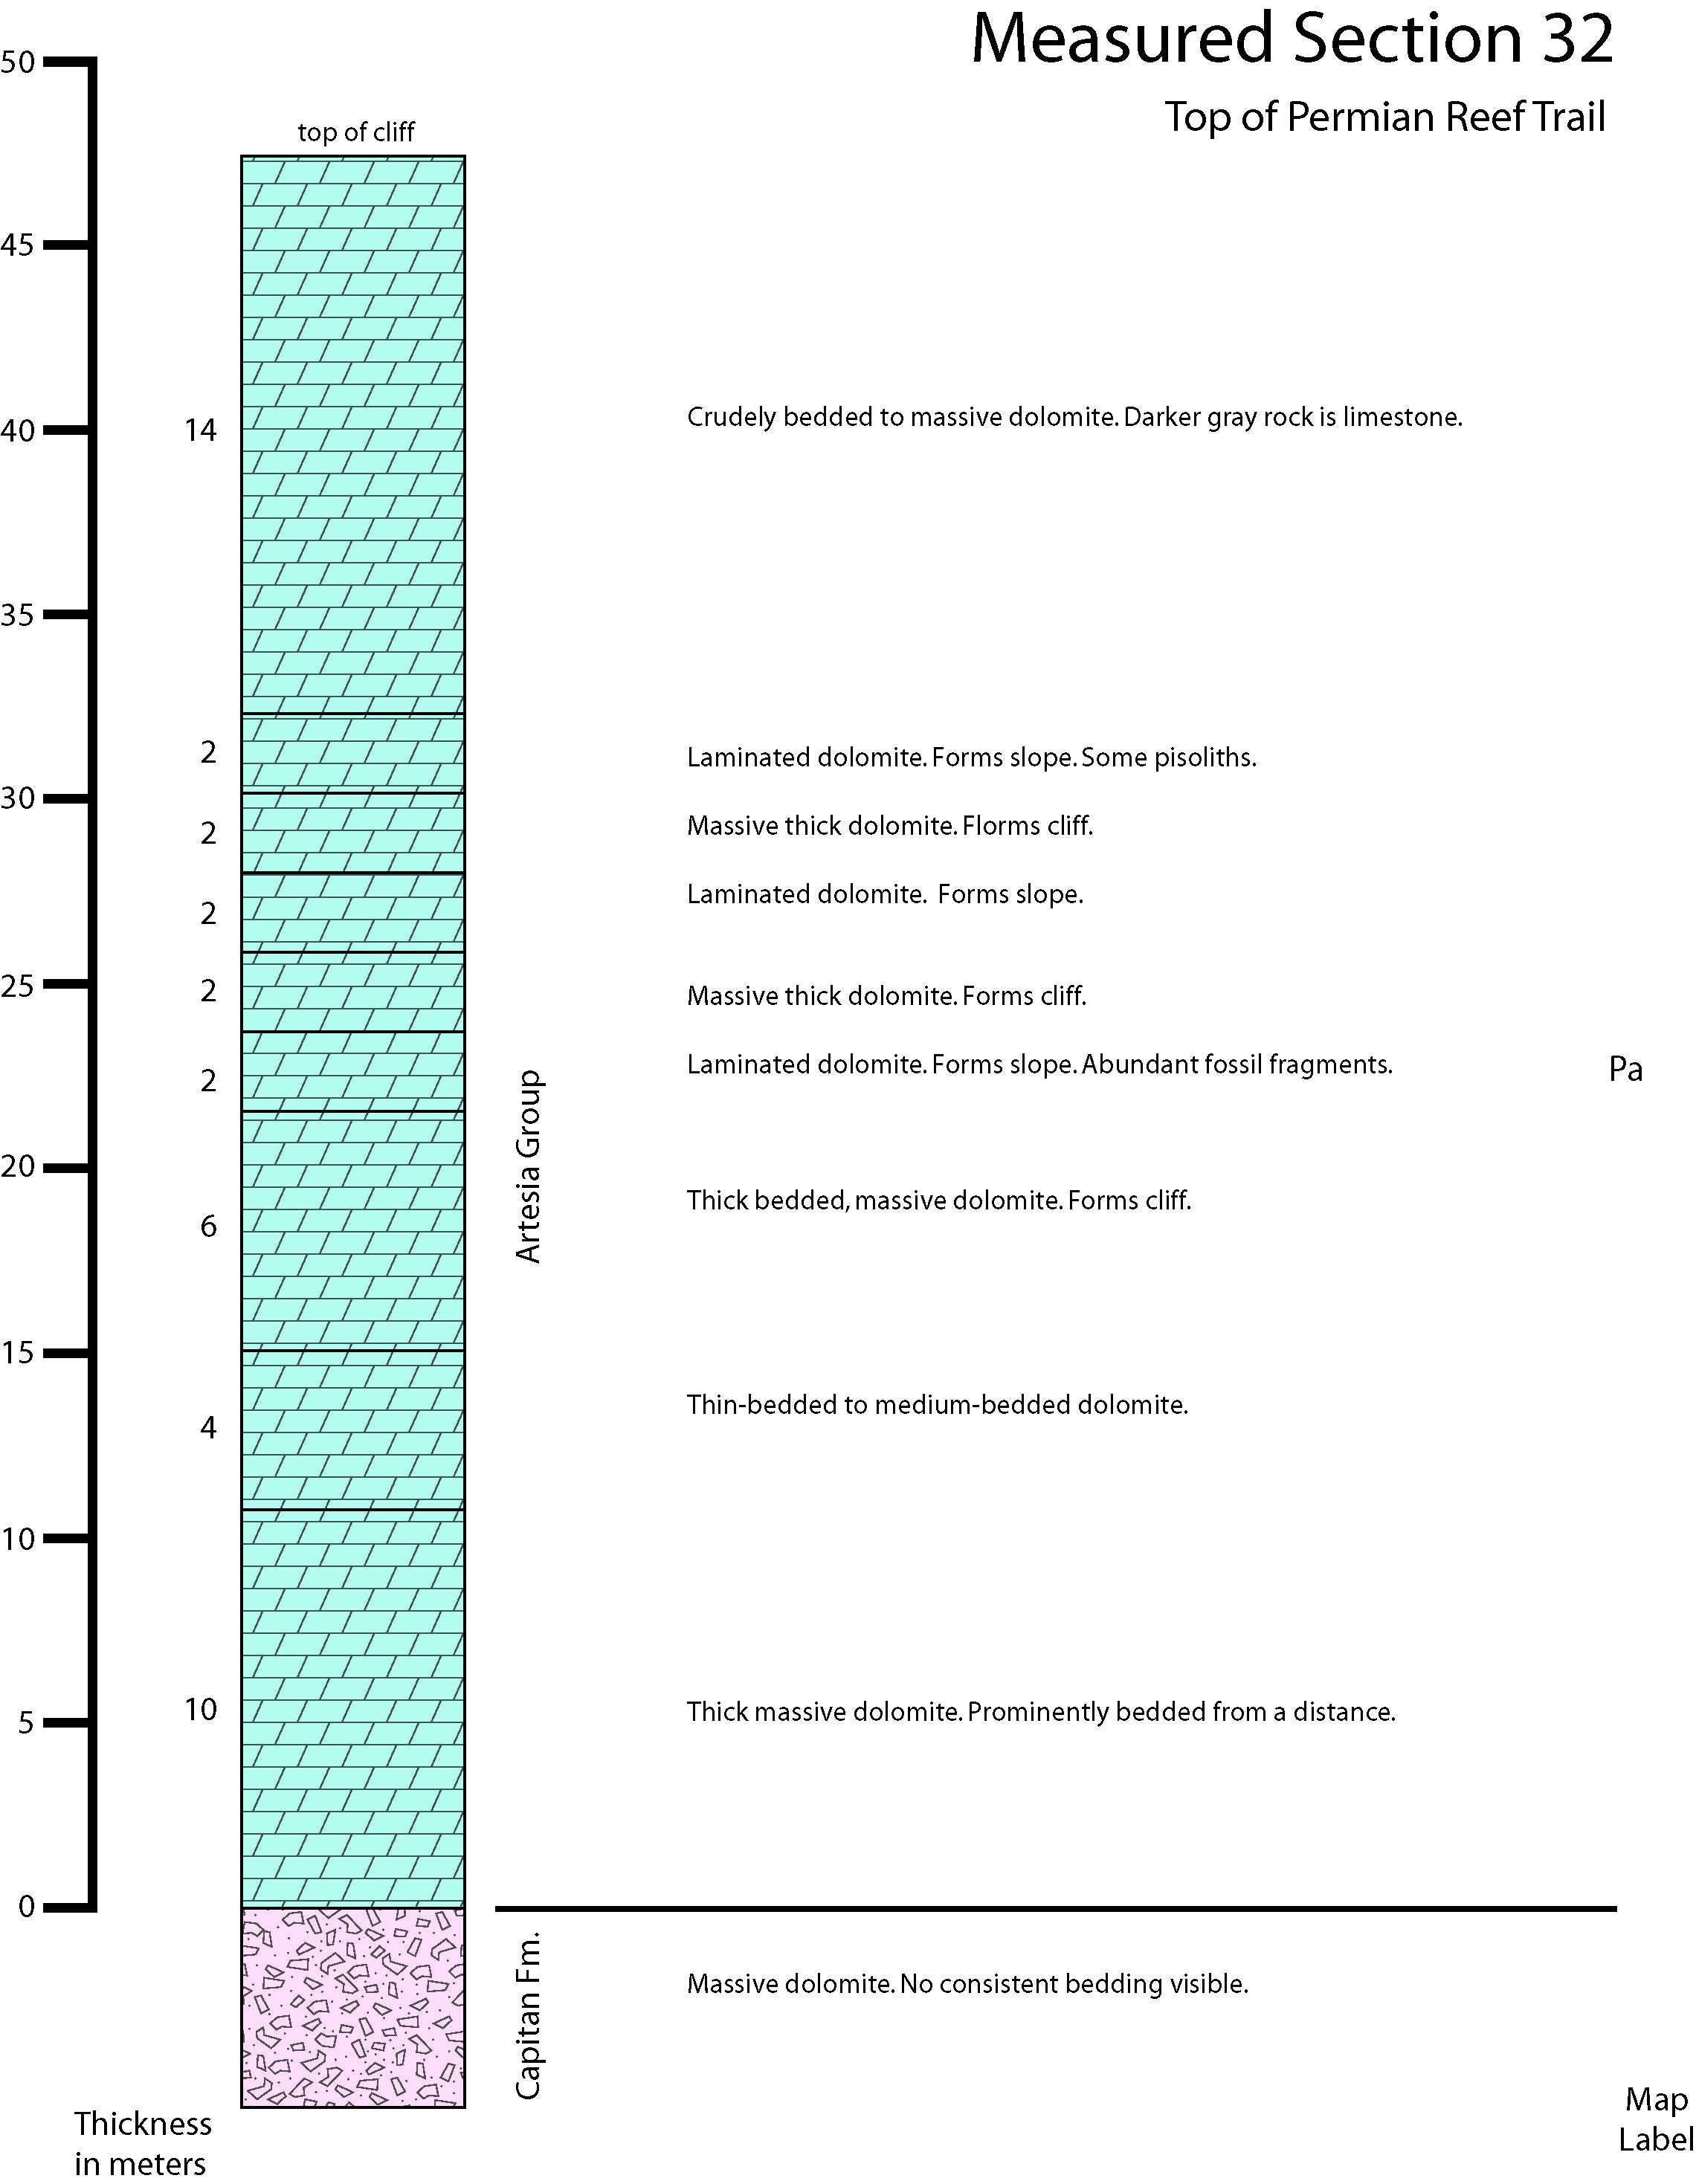
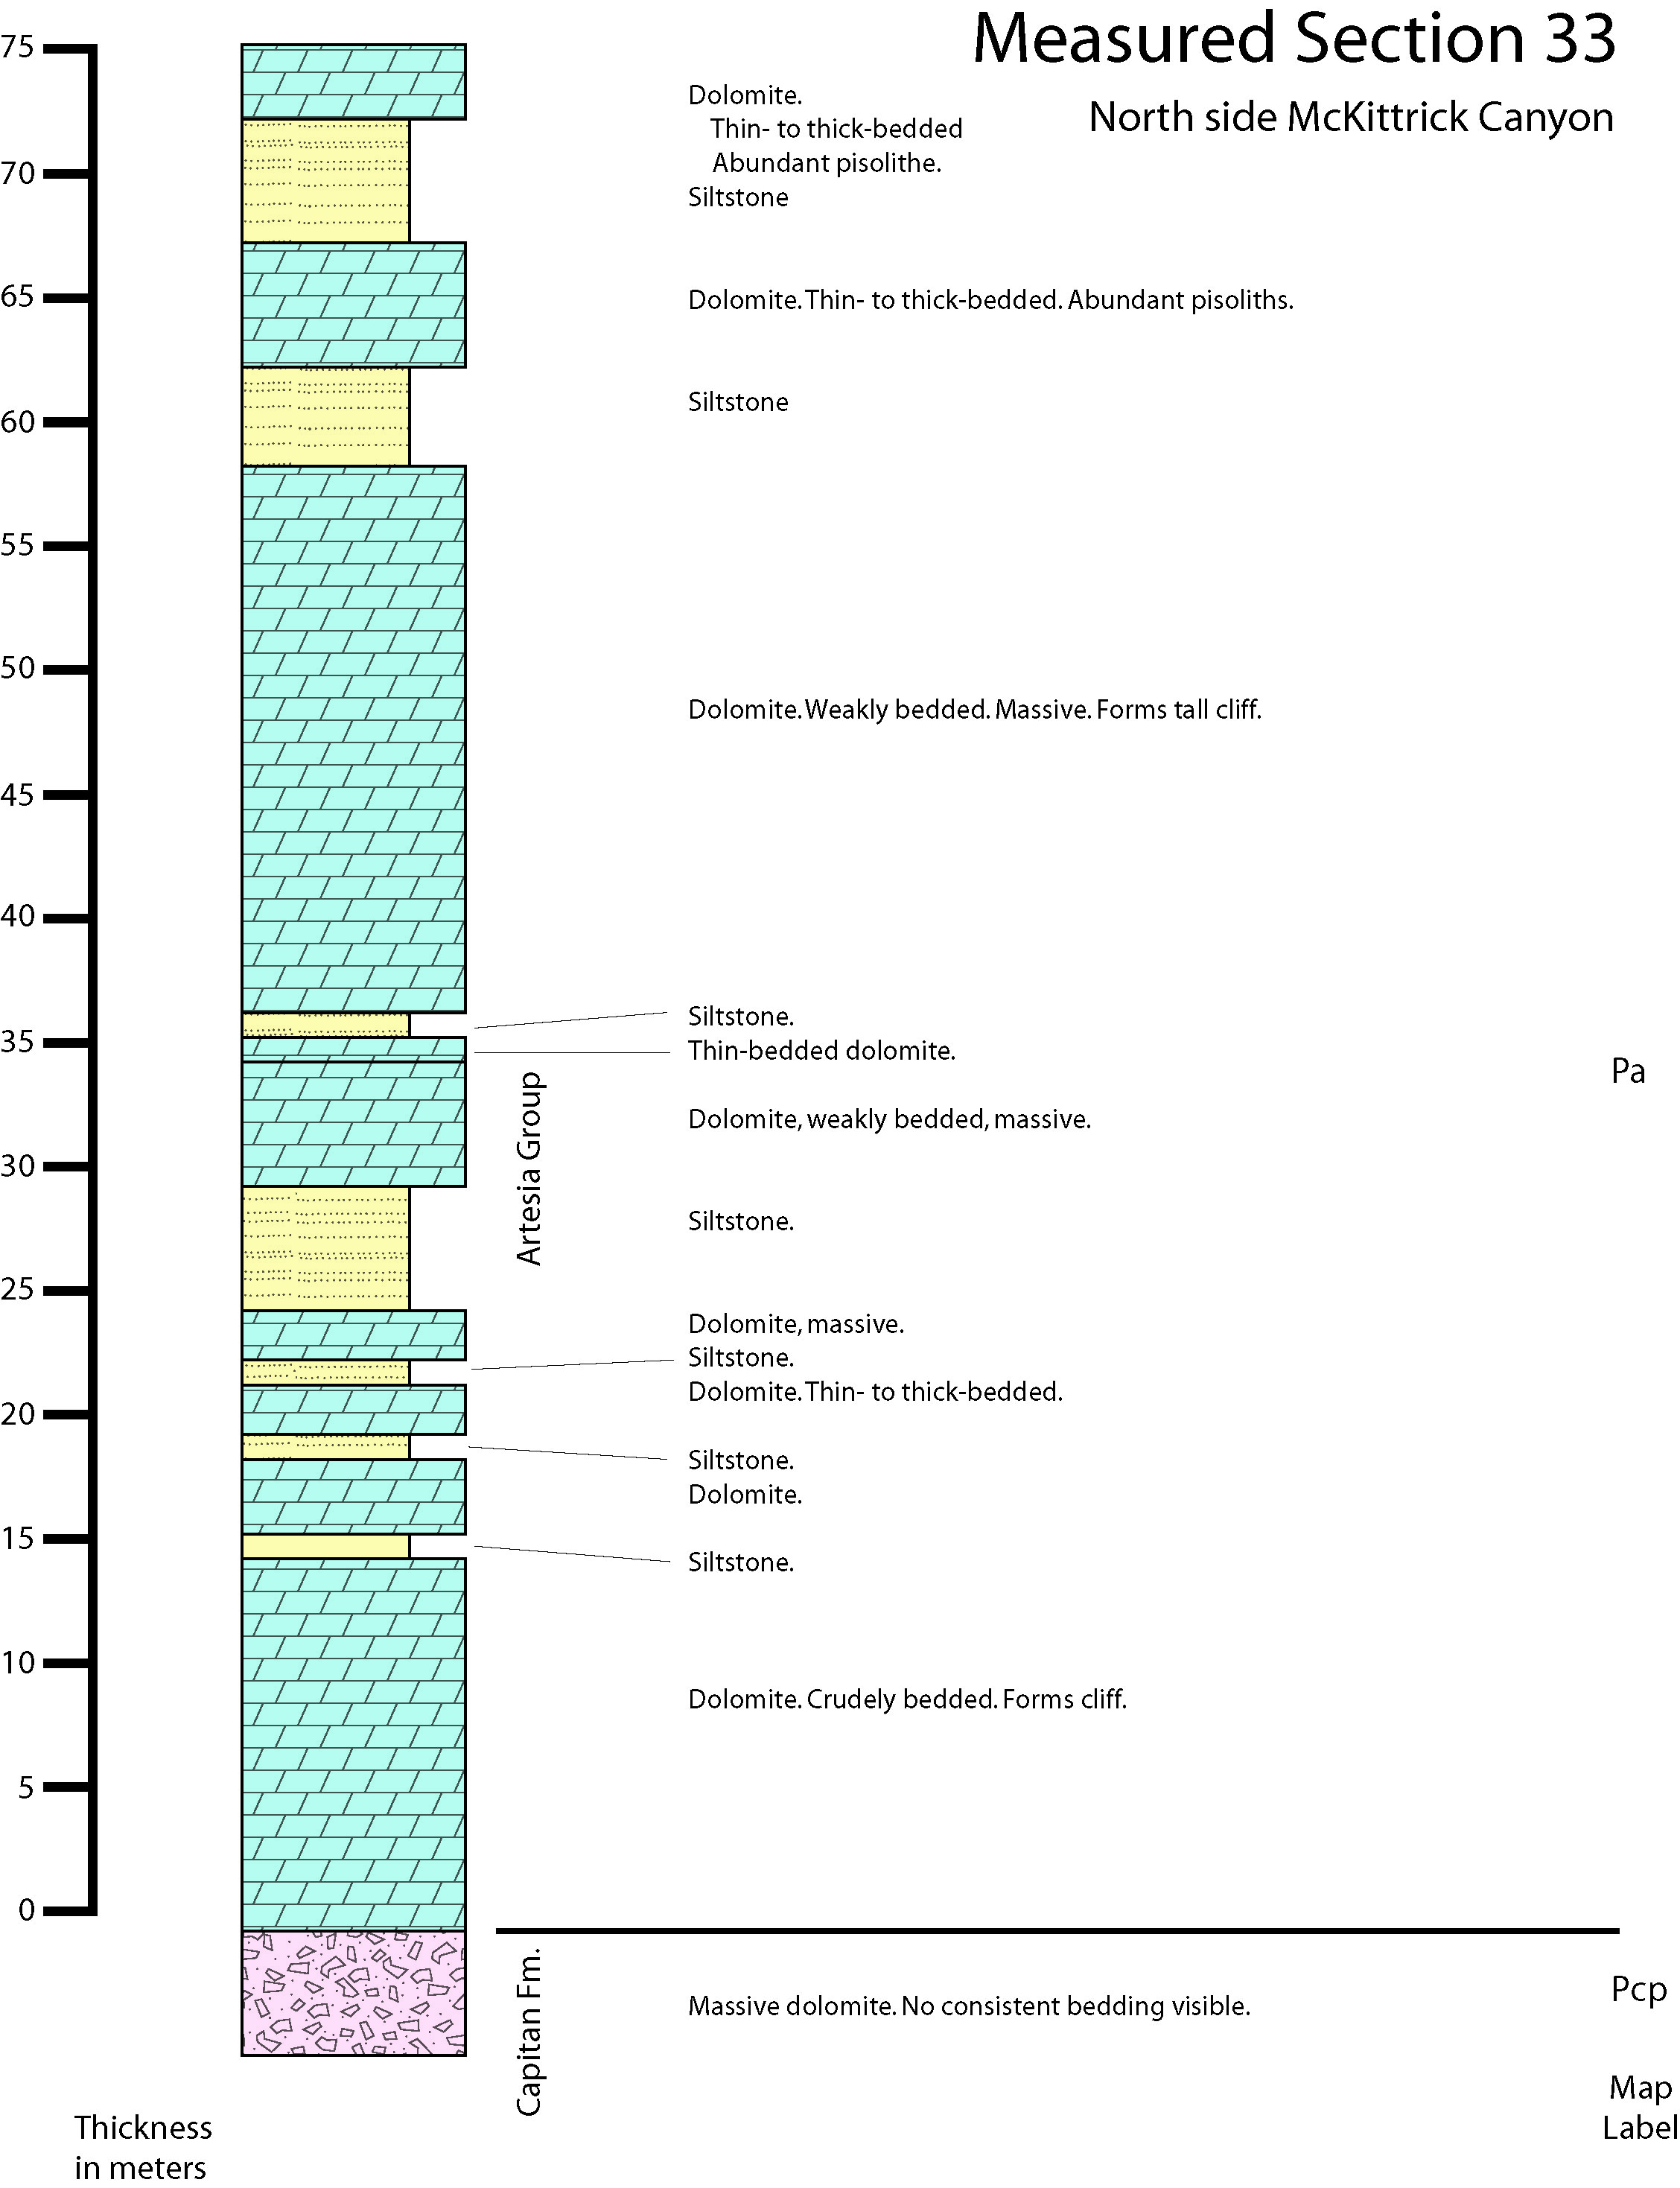
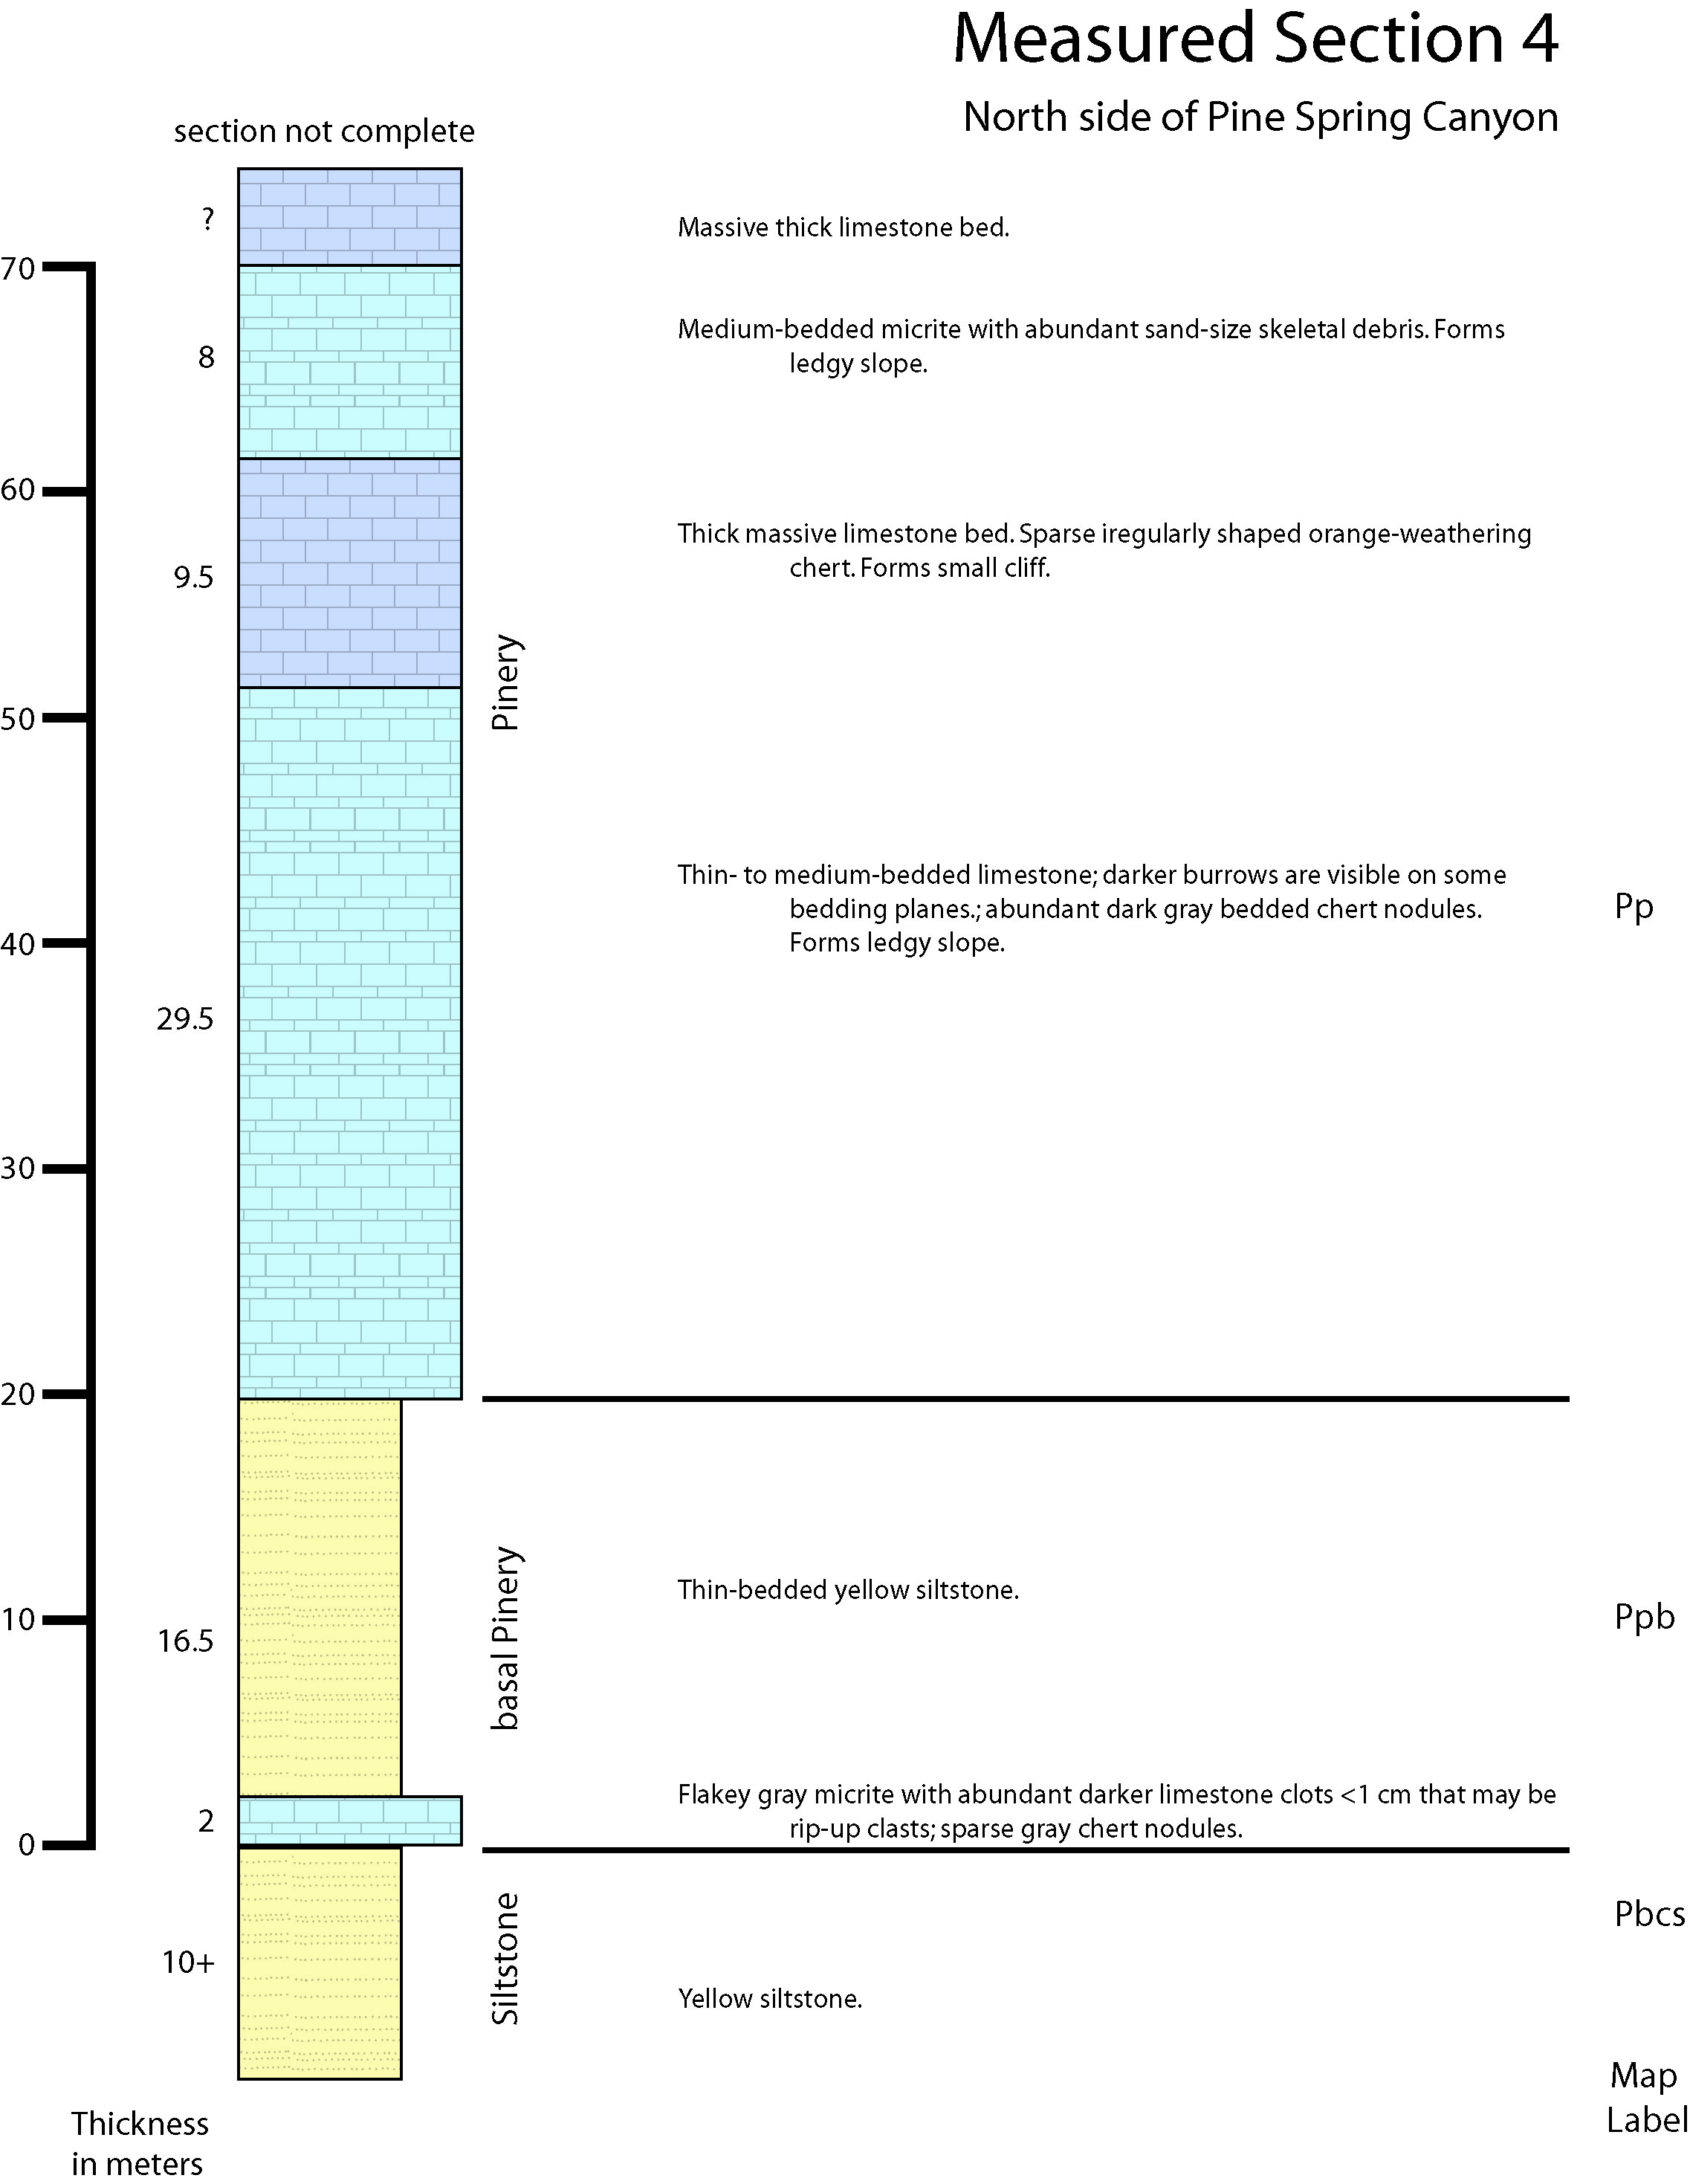
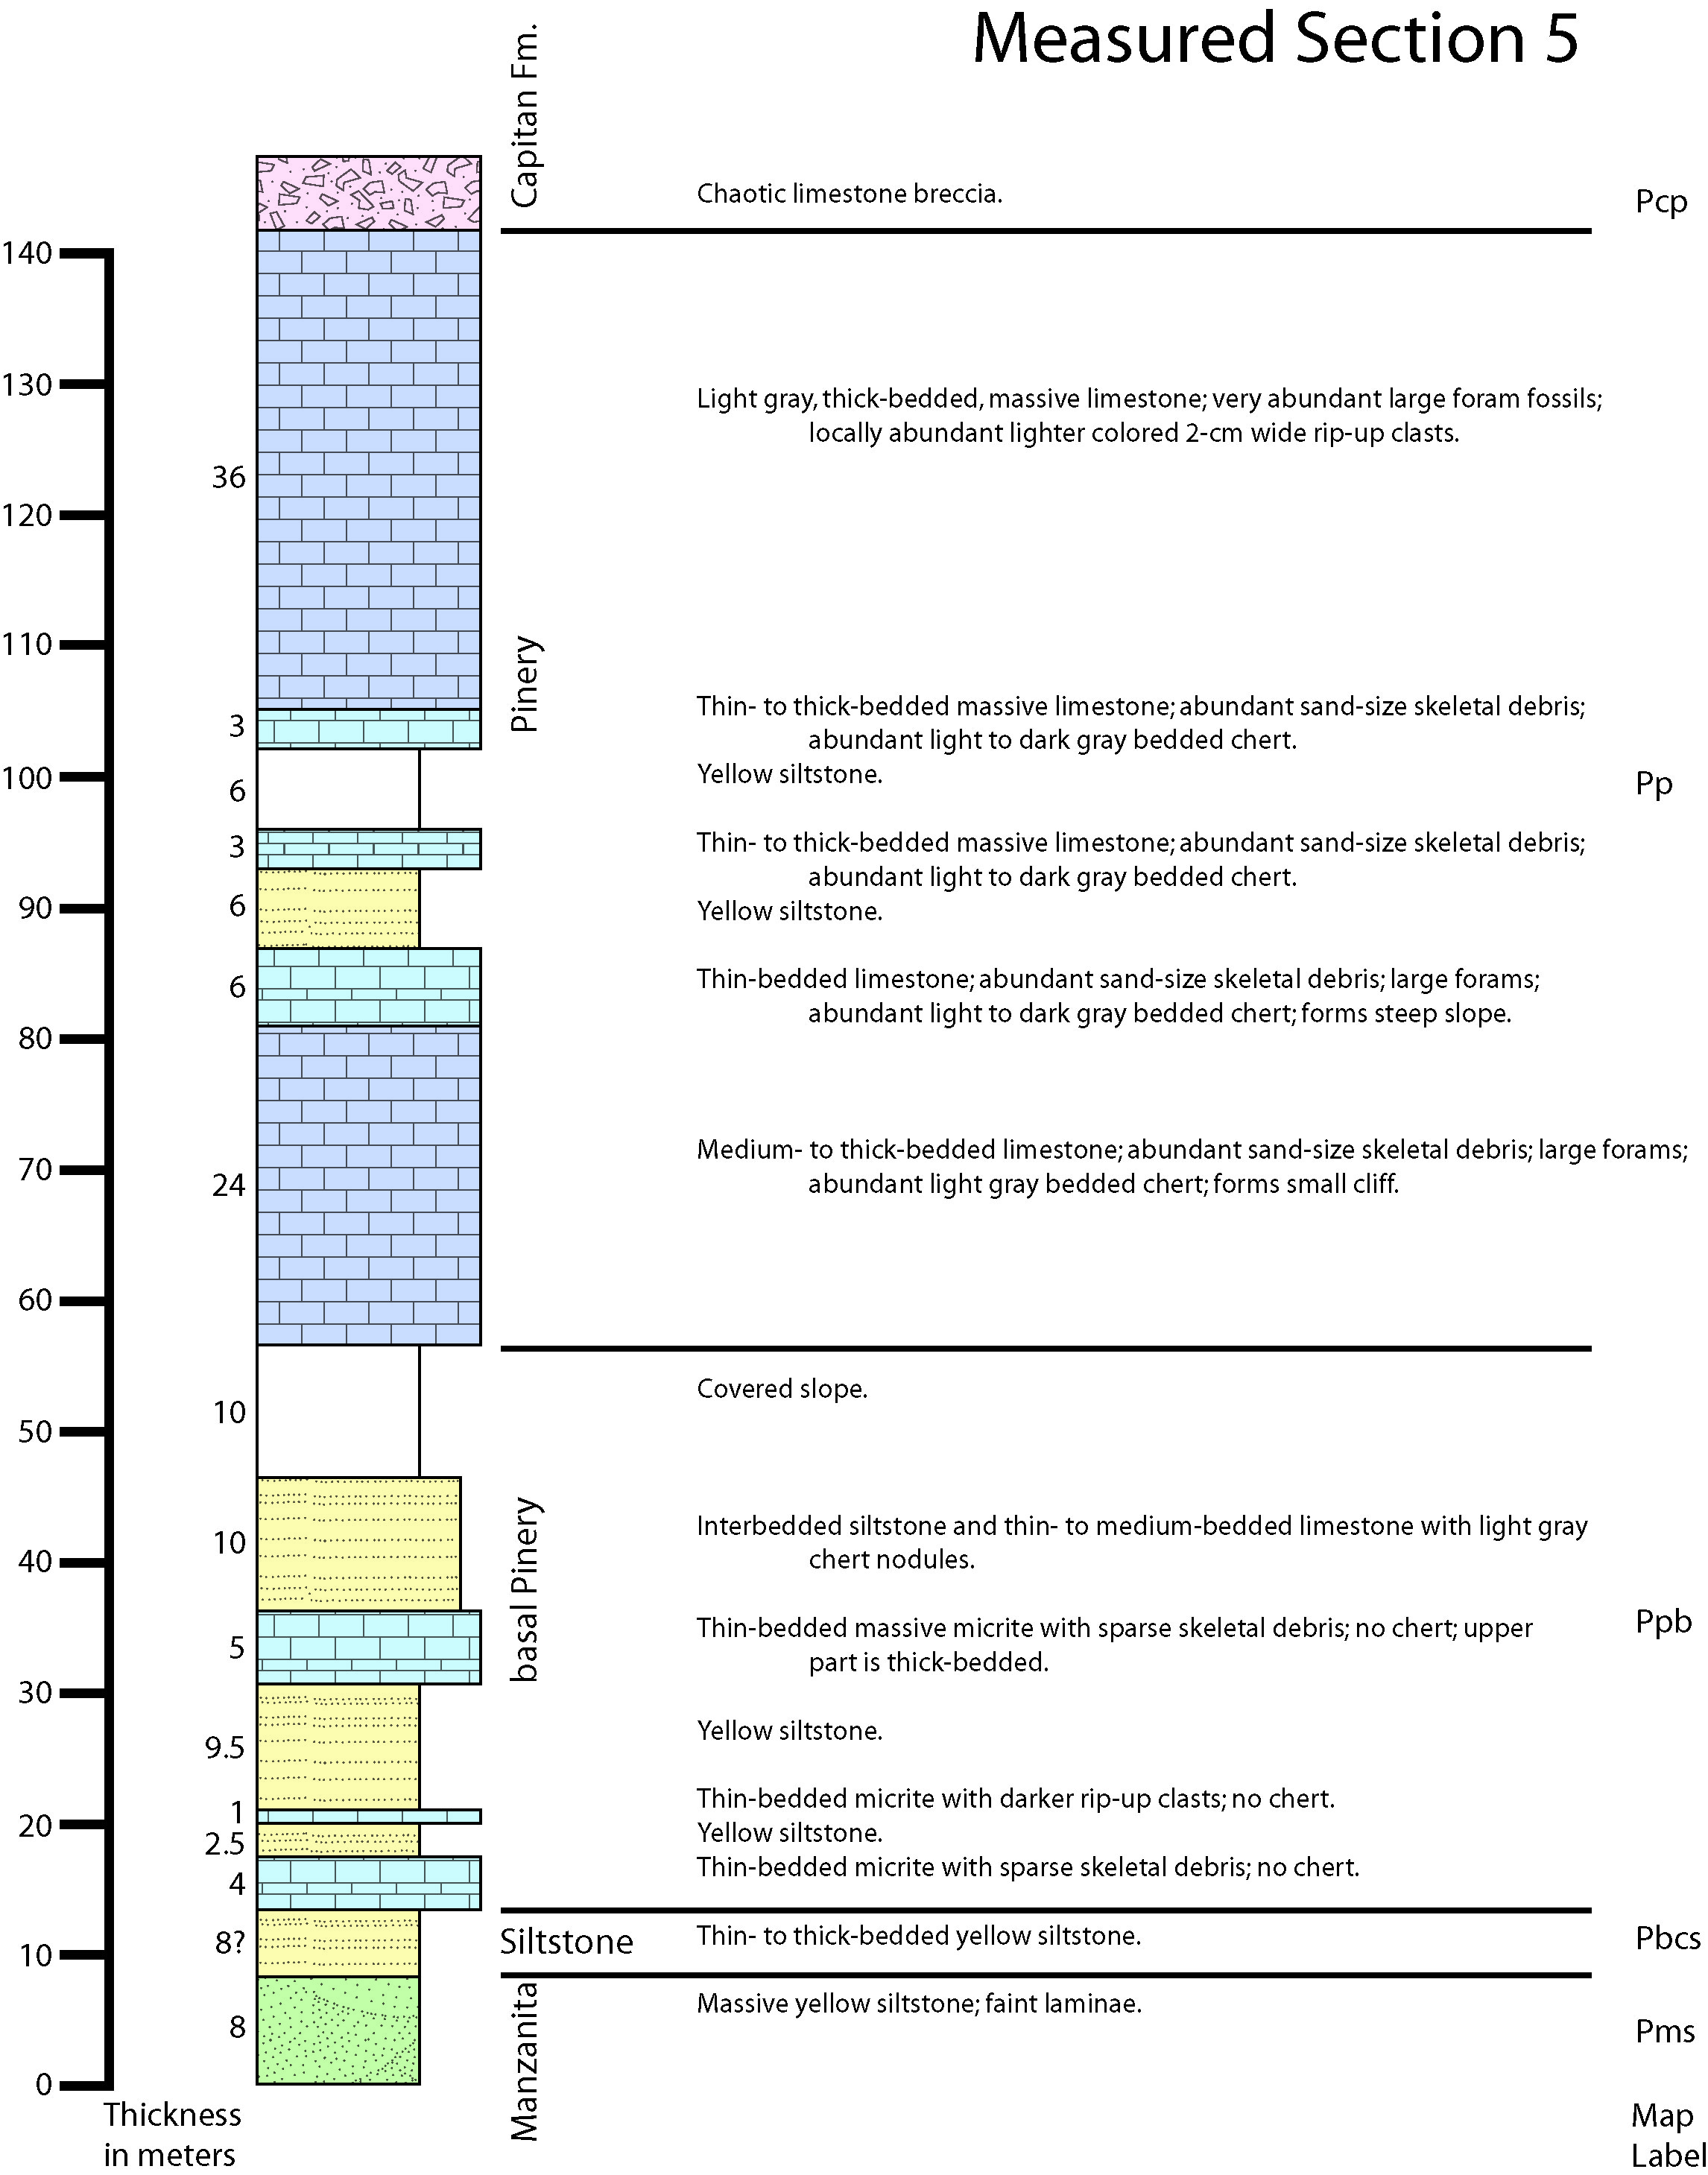
| Measured Sections: | ||
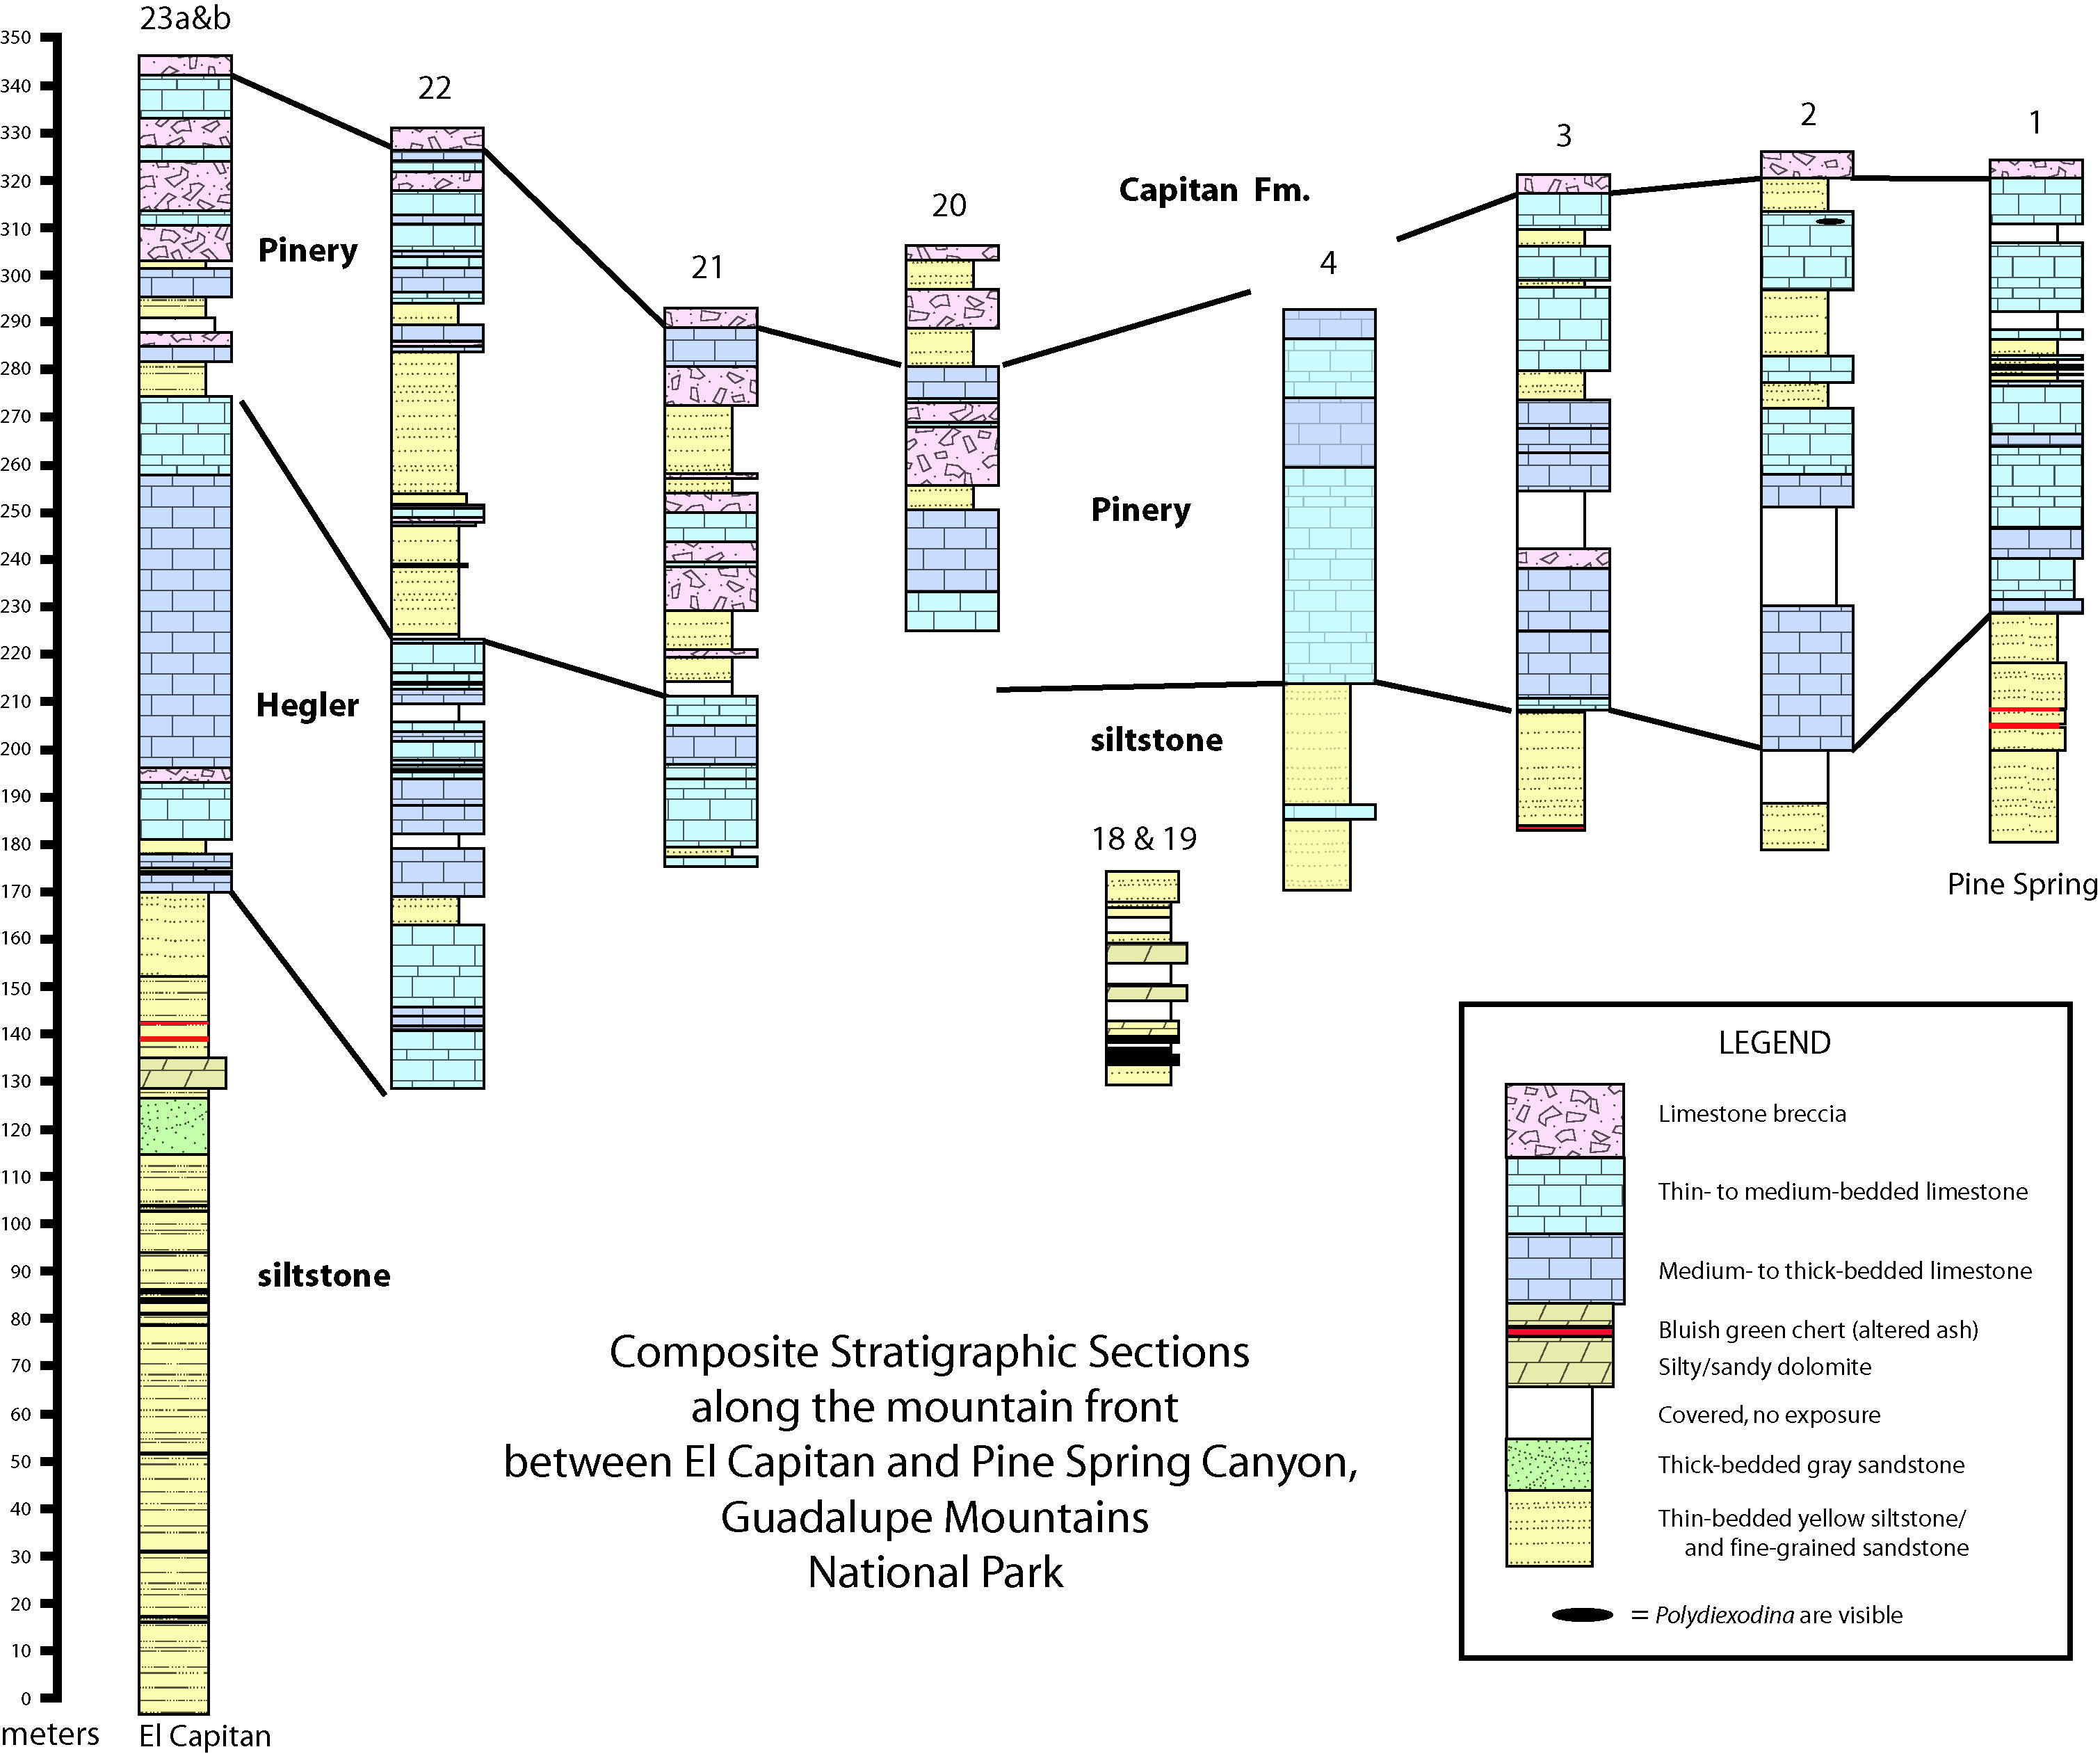
| Composite Strat Sections 1.jpg | 1.09 MB | 09/03/2020 11:13:28 AM |
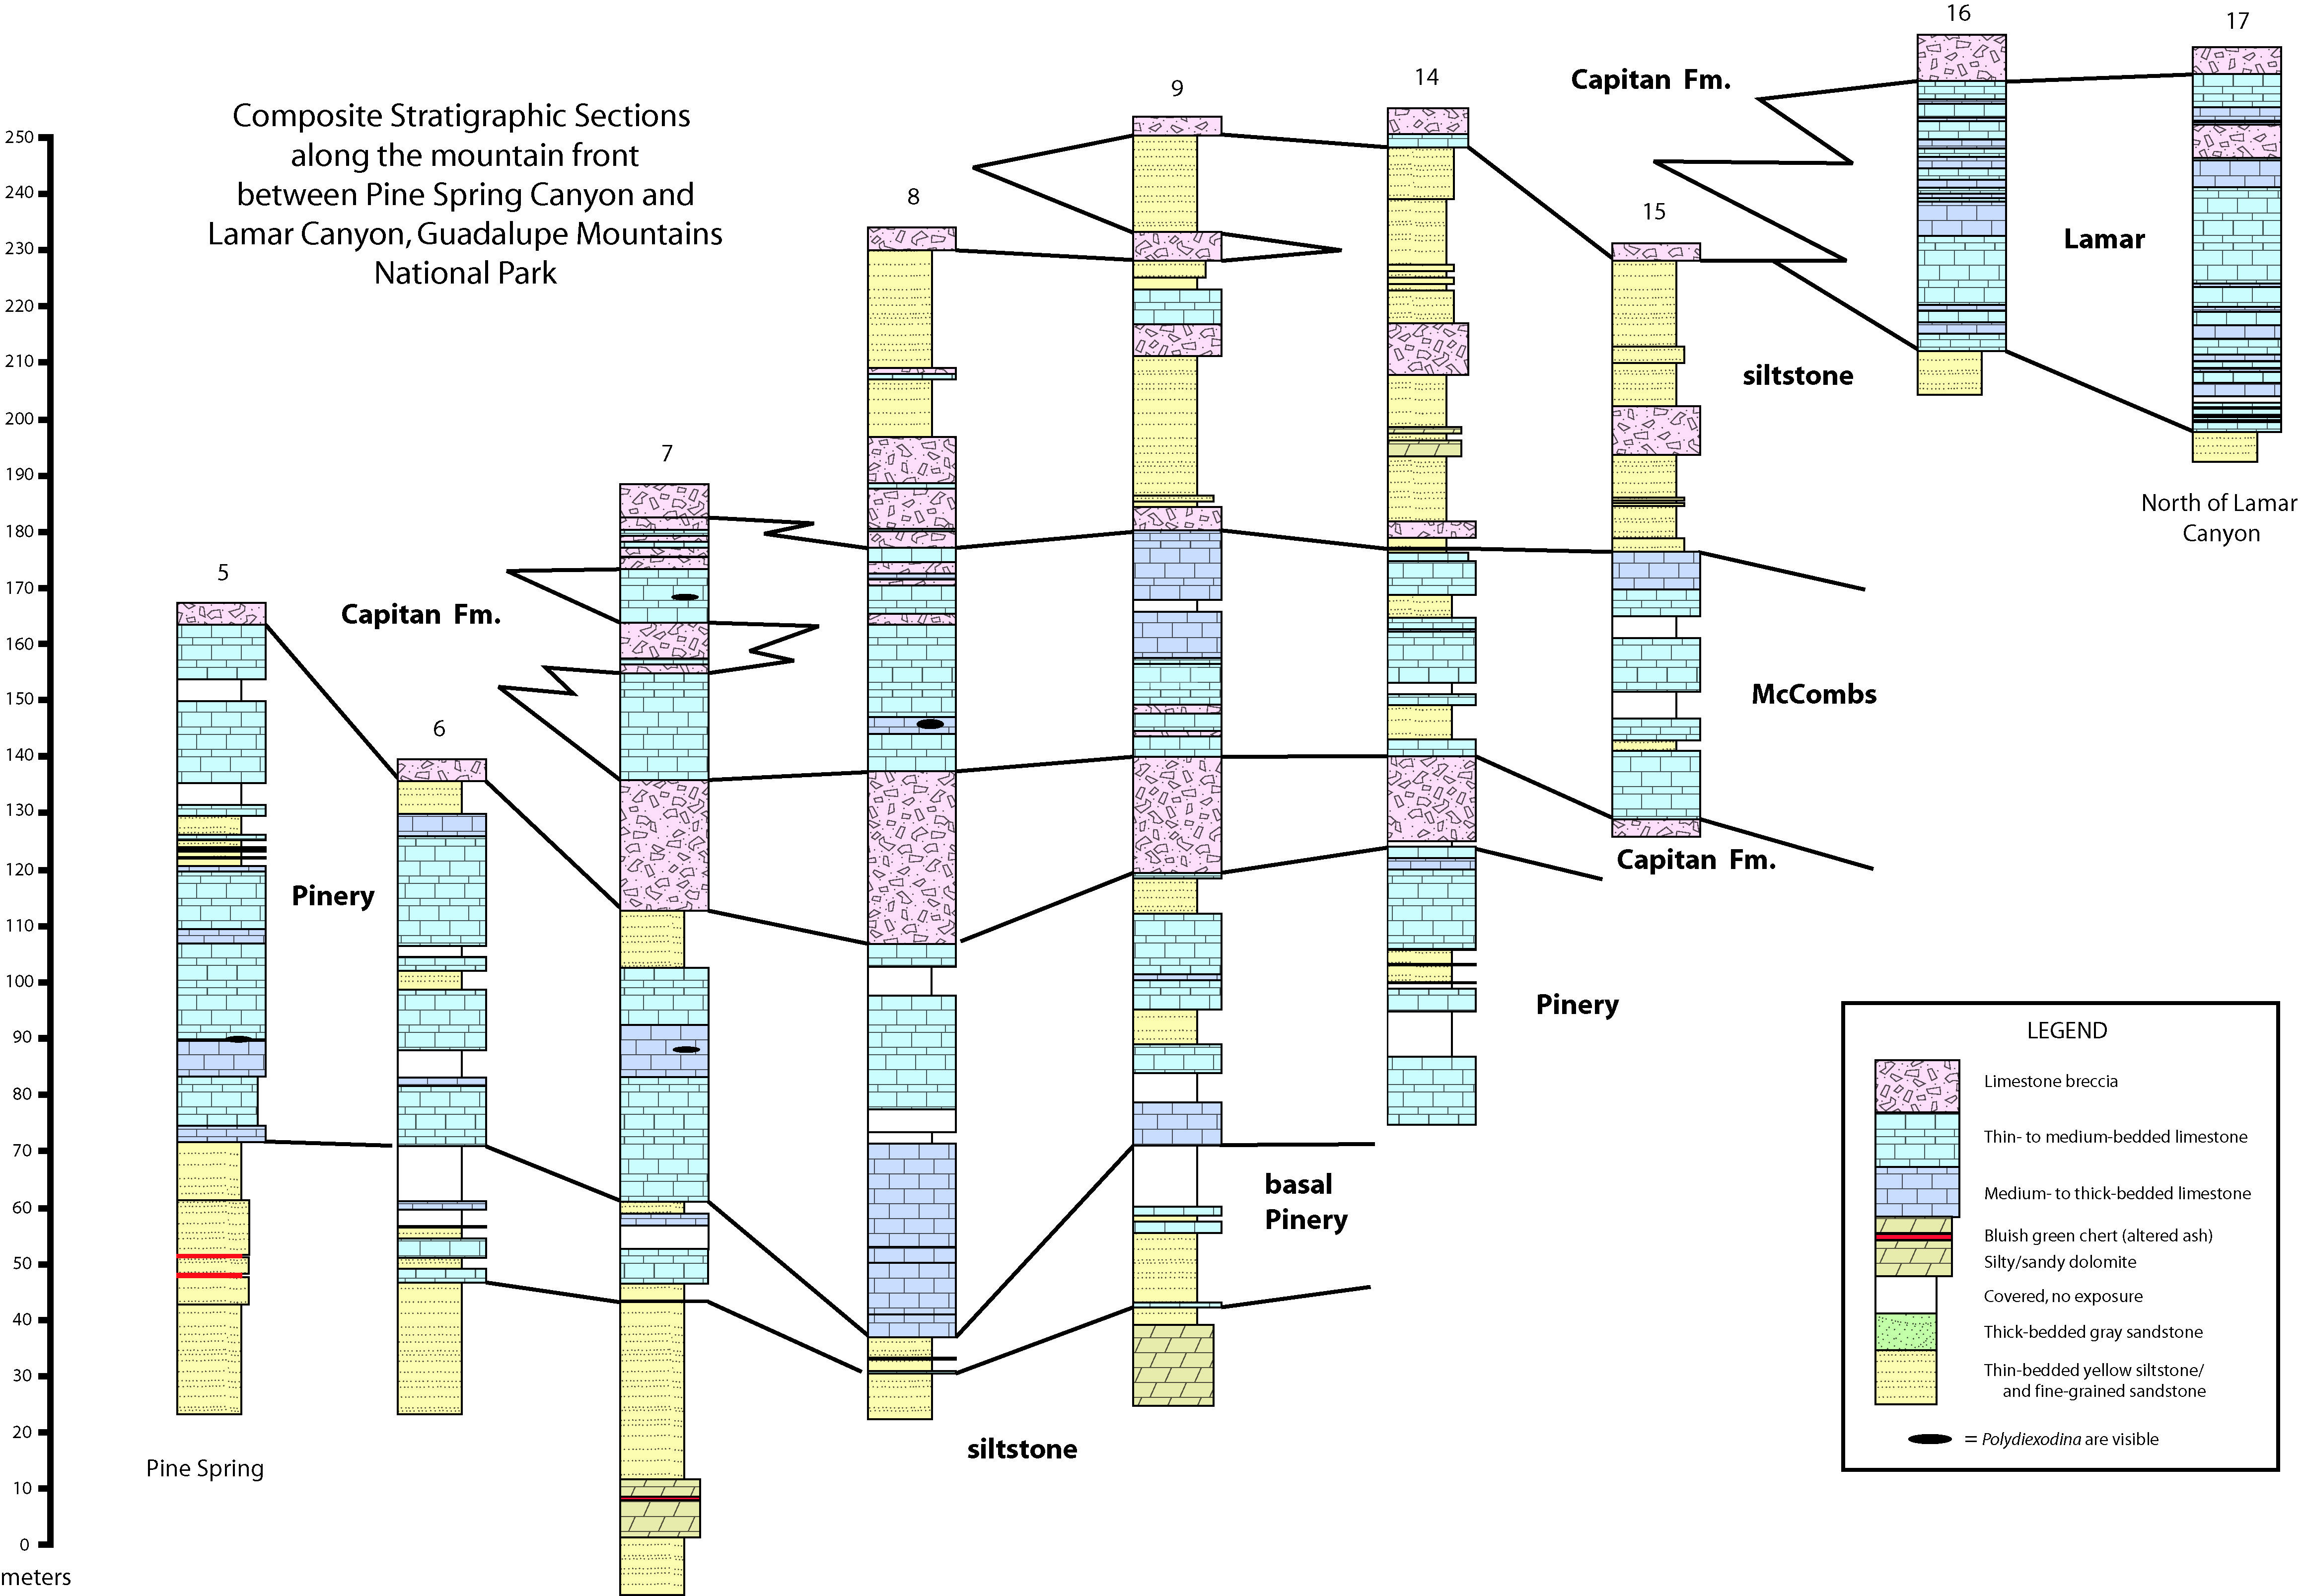
| Composite Strat Sections 2.jpg | 2.03 MB | 09/03/2020 11:13:28 AM |
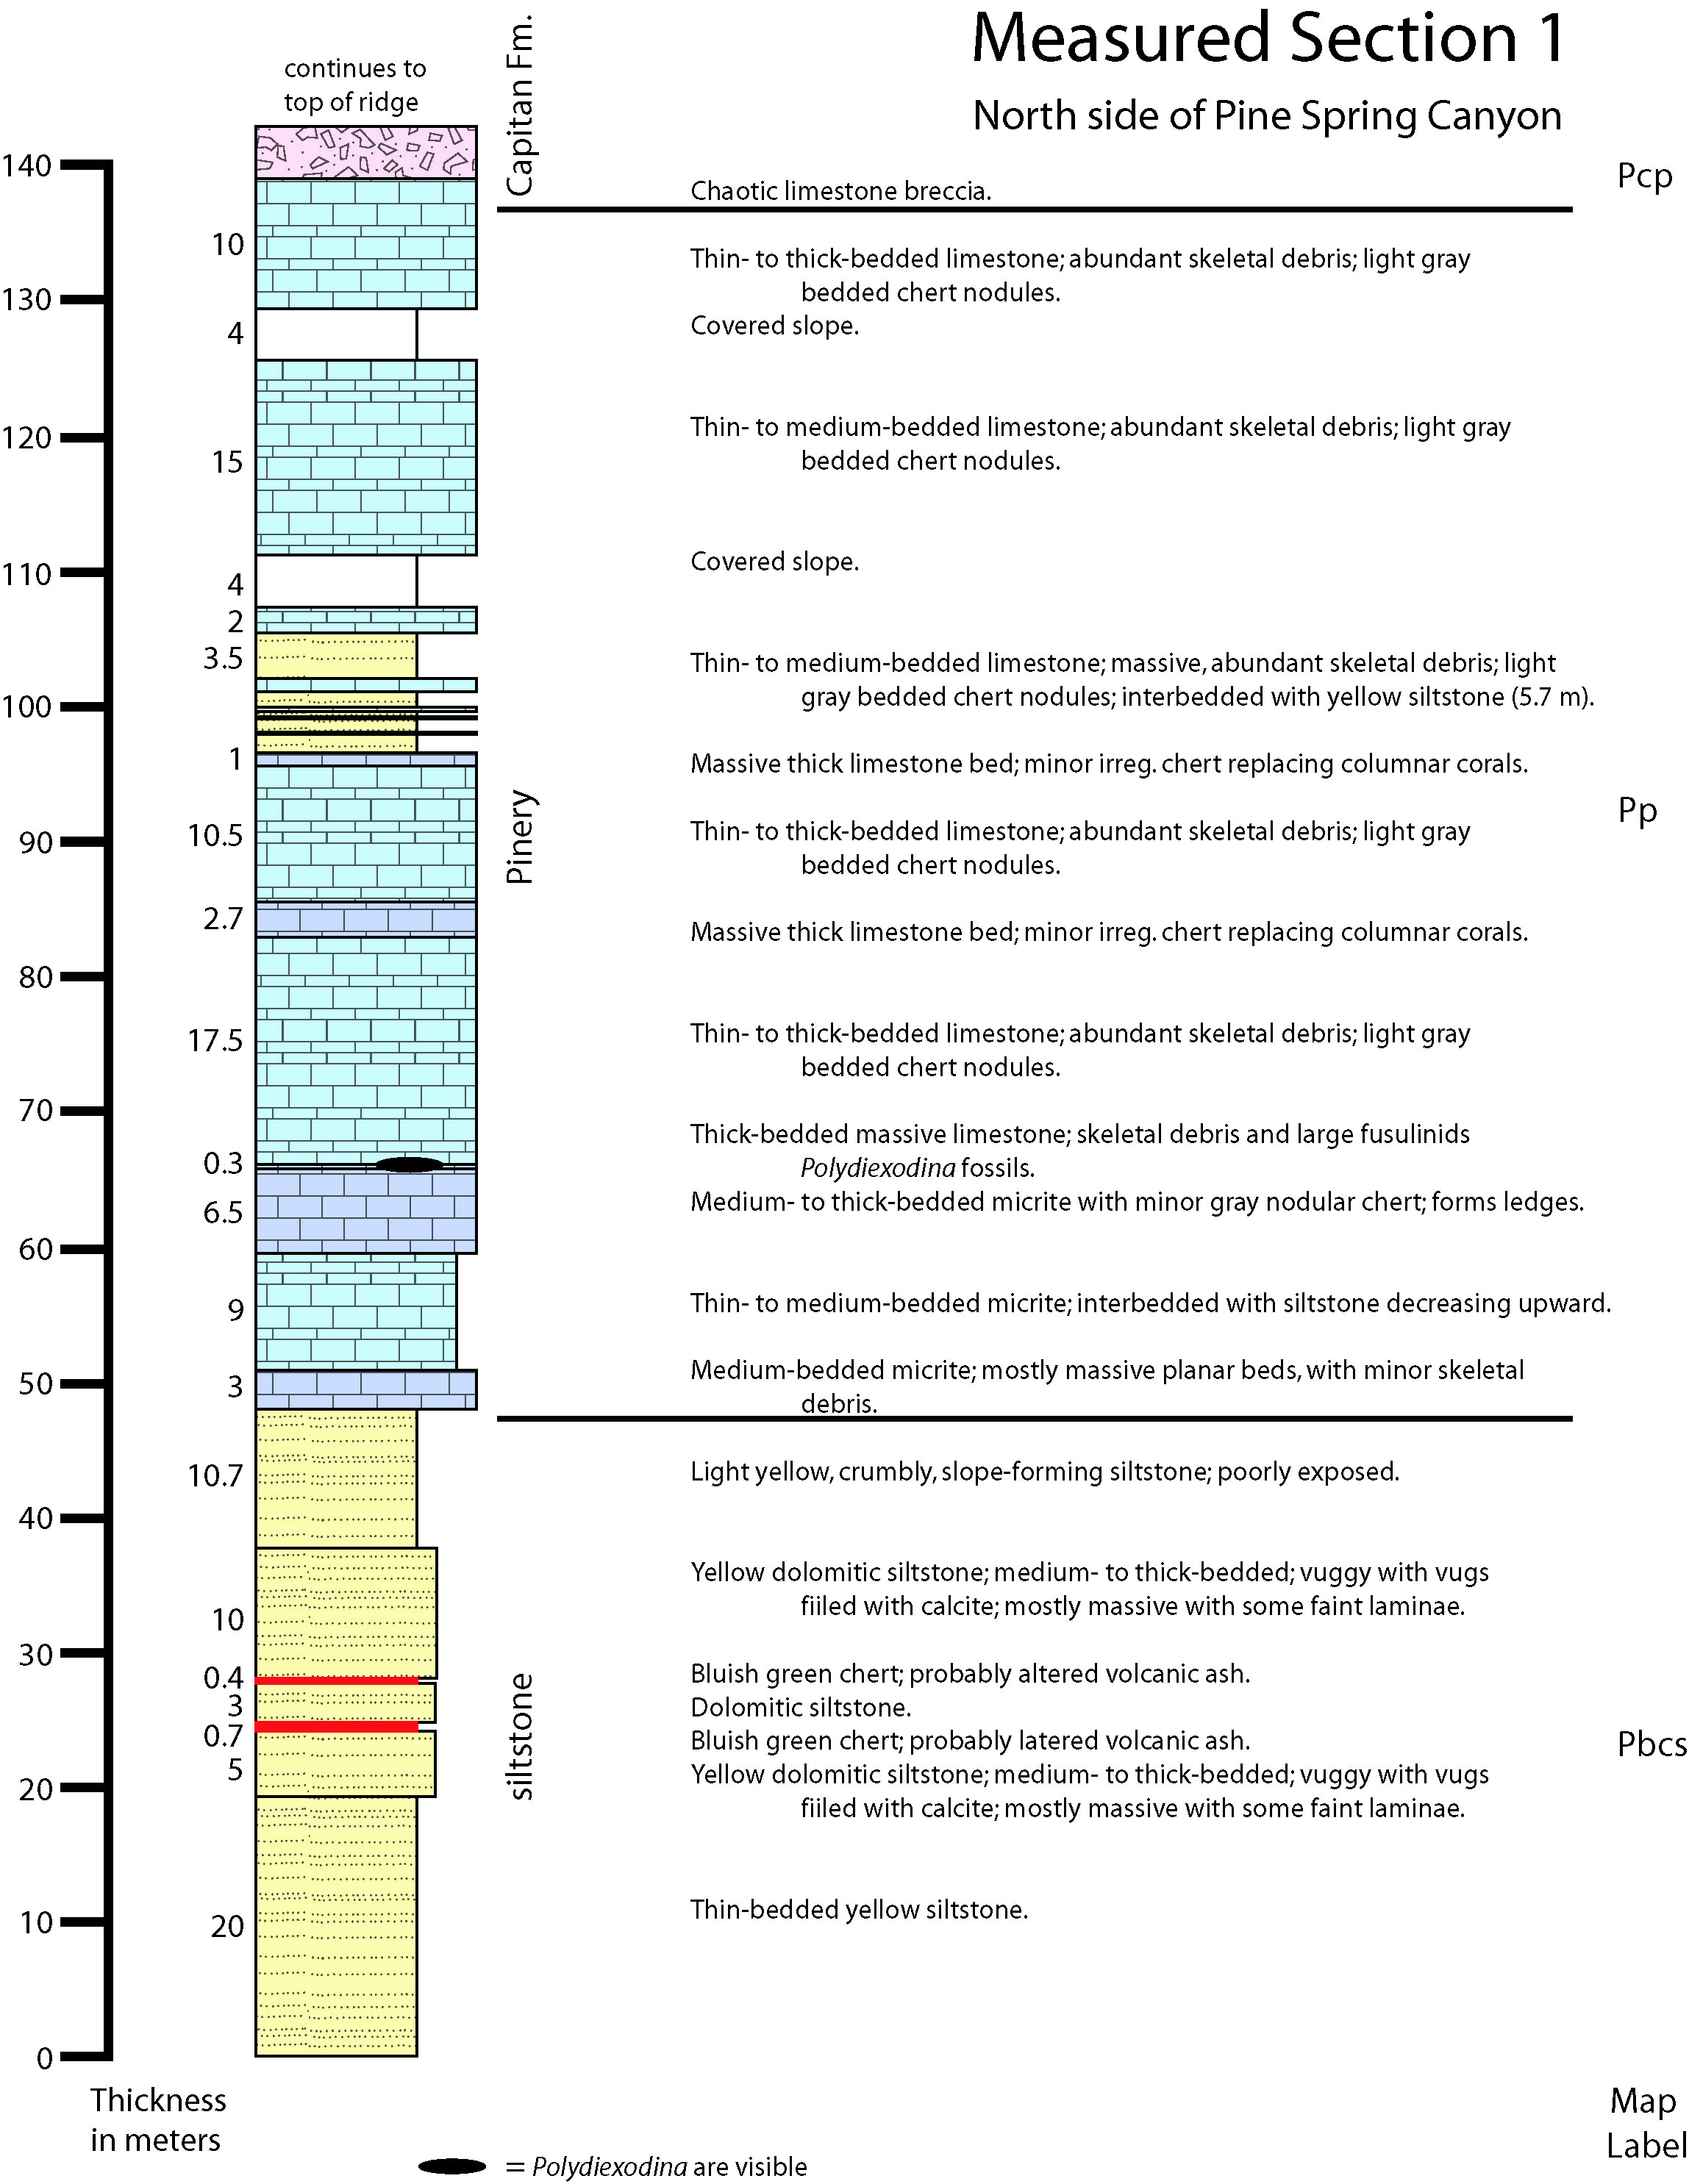
| Measured Section 1.jpg | 1.04 MB | 09/03/2020 11:13:28 AM |
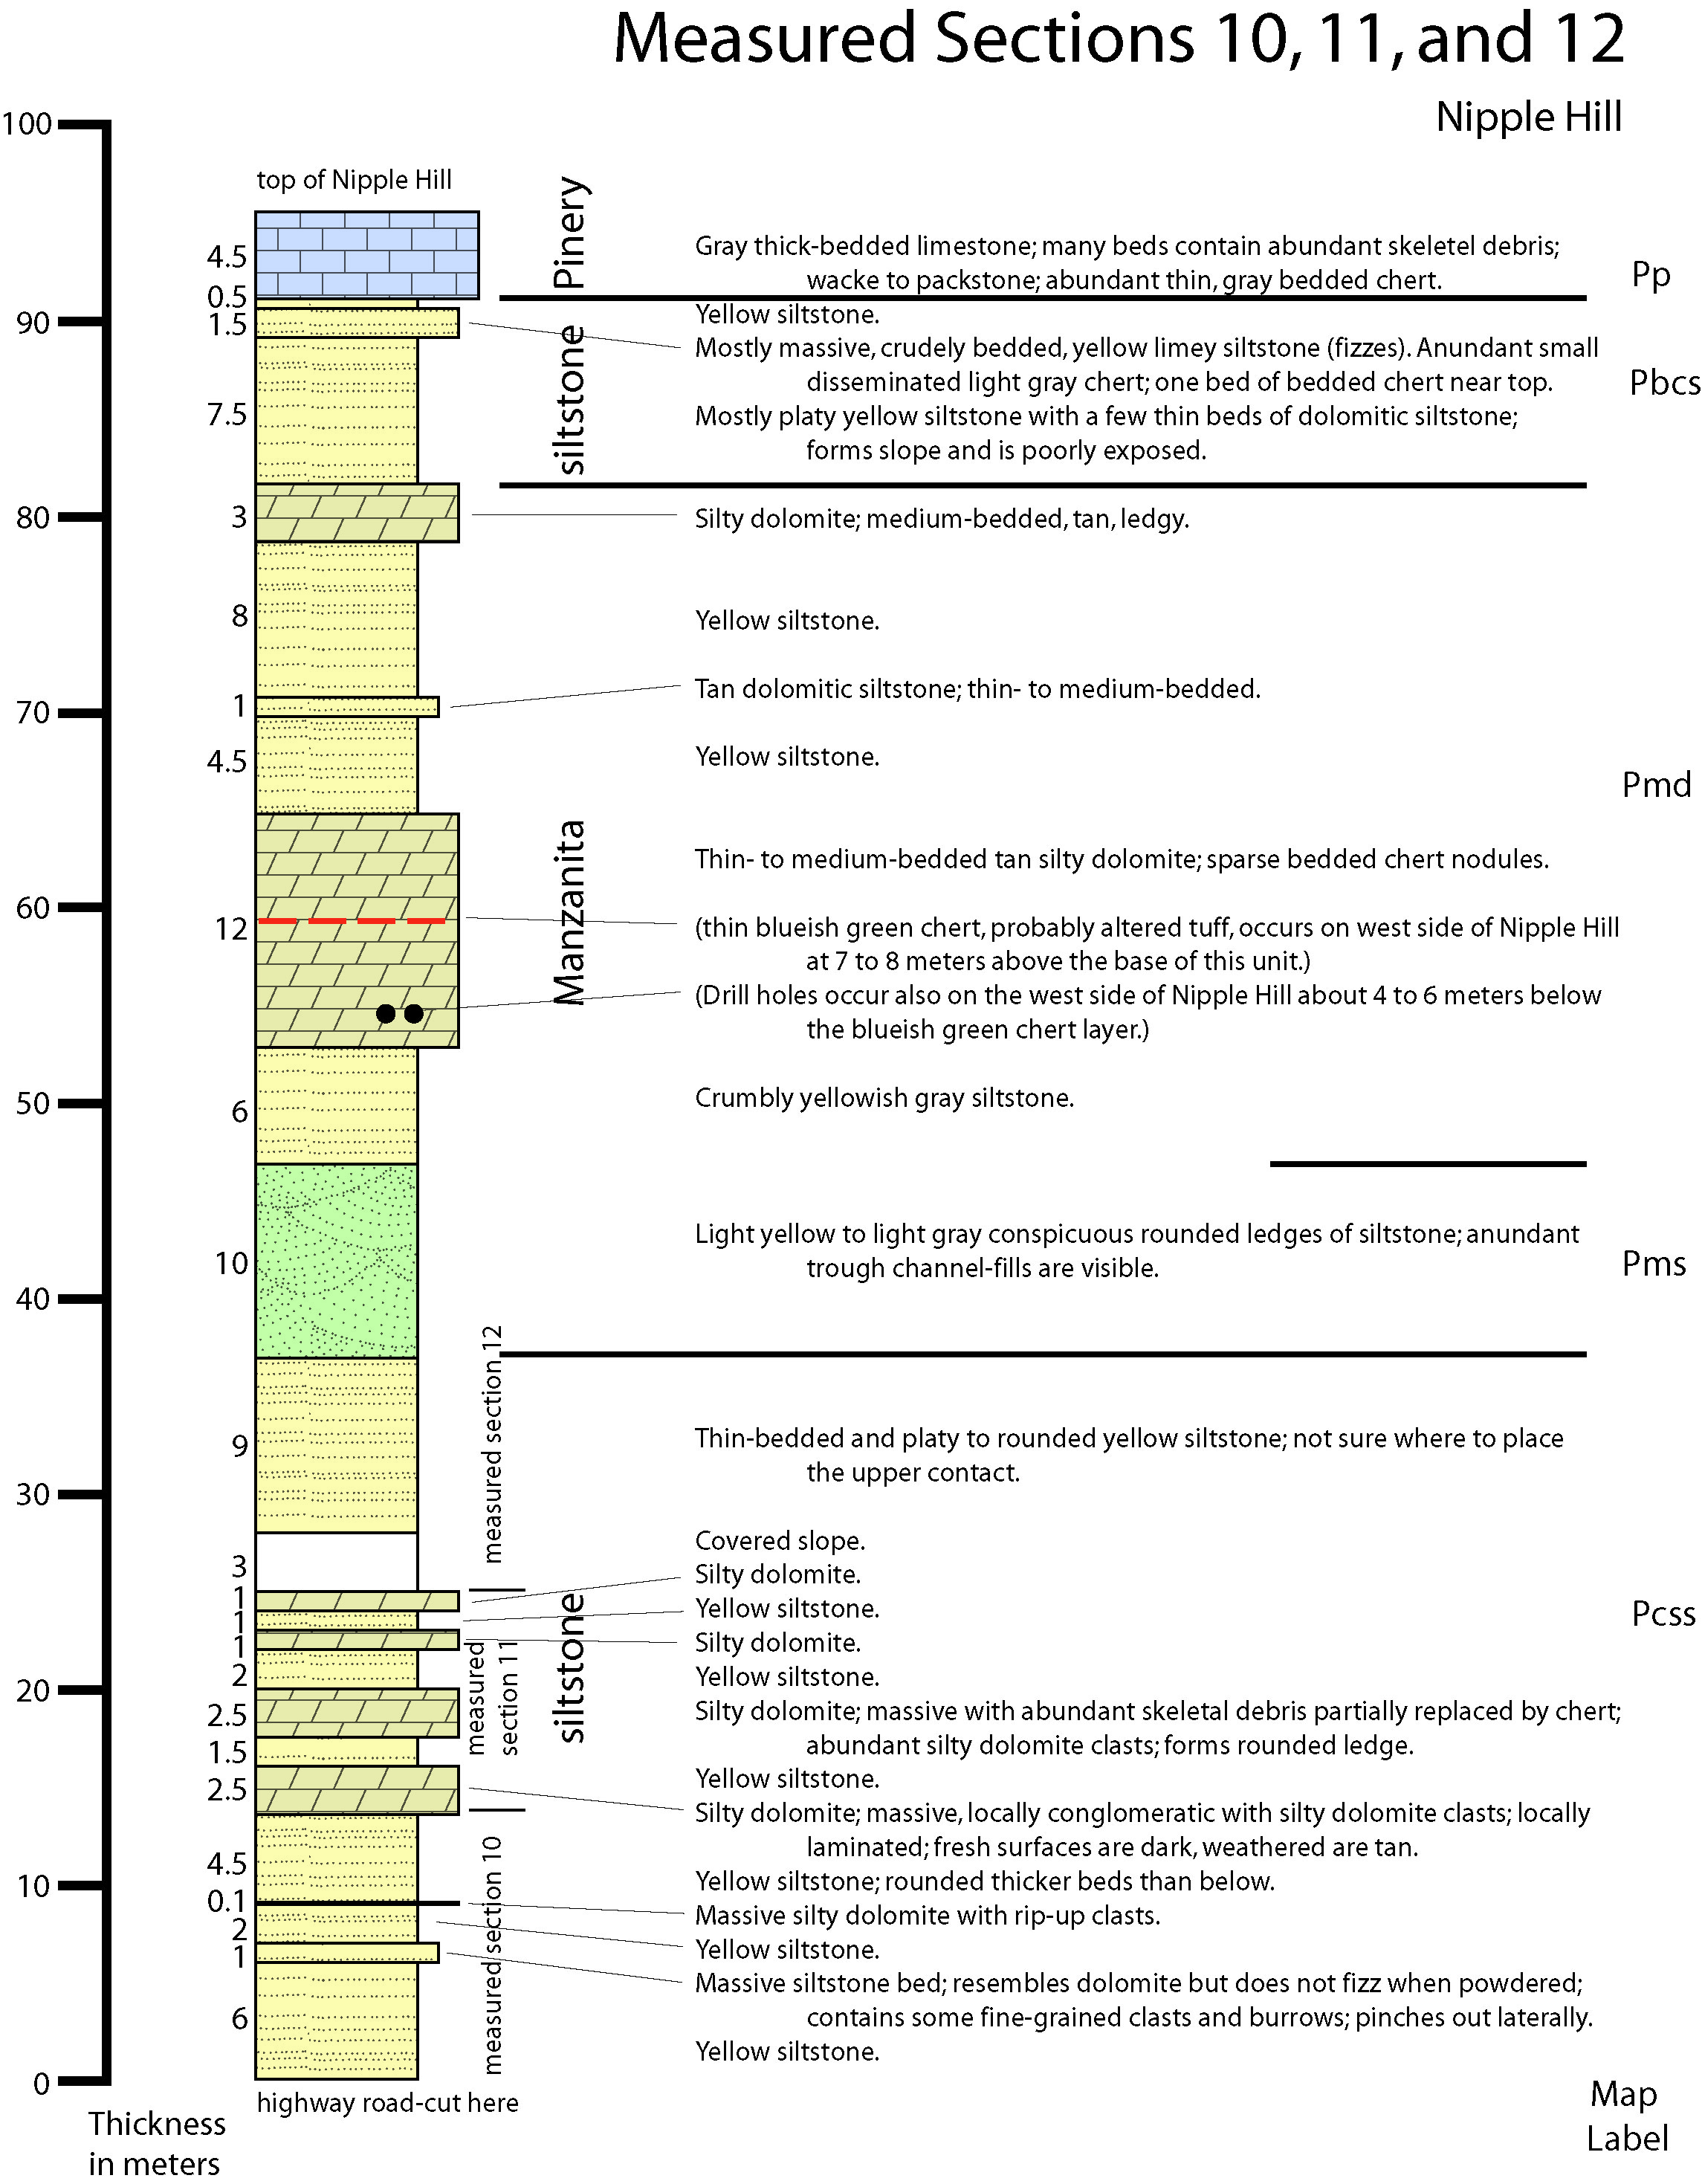
| Measured Section 10 11 and 12.jpg | 1.12 MB | 09/03/2020 11:13:26 AM |
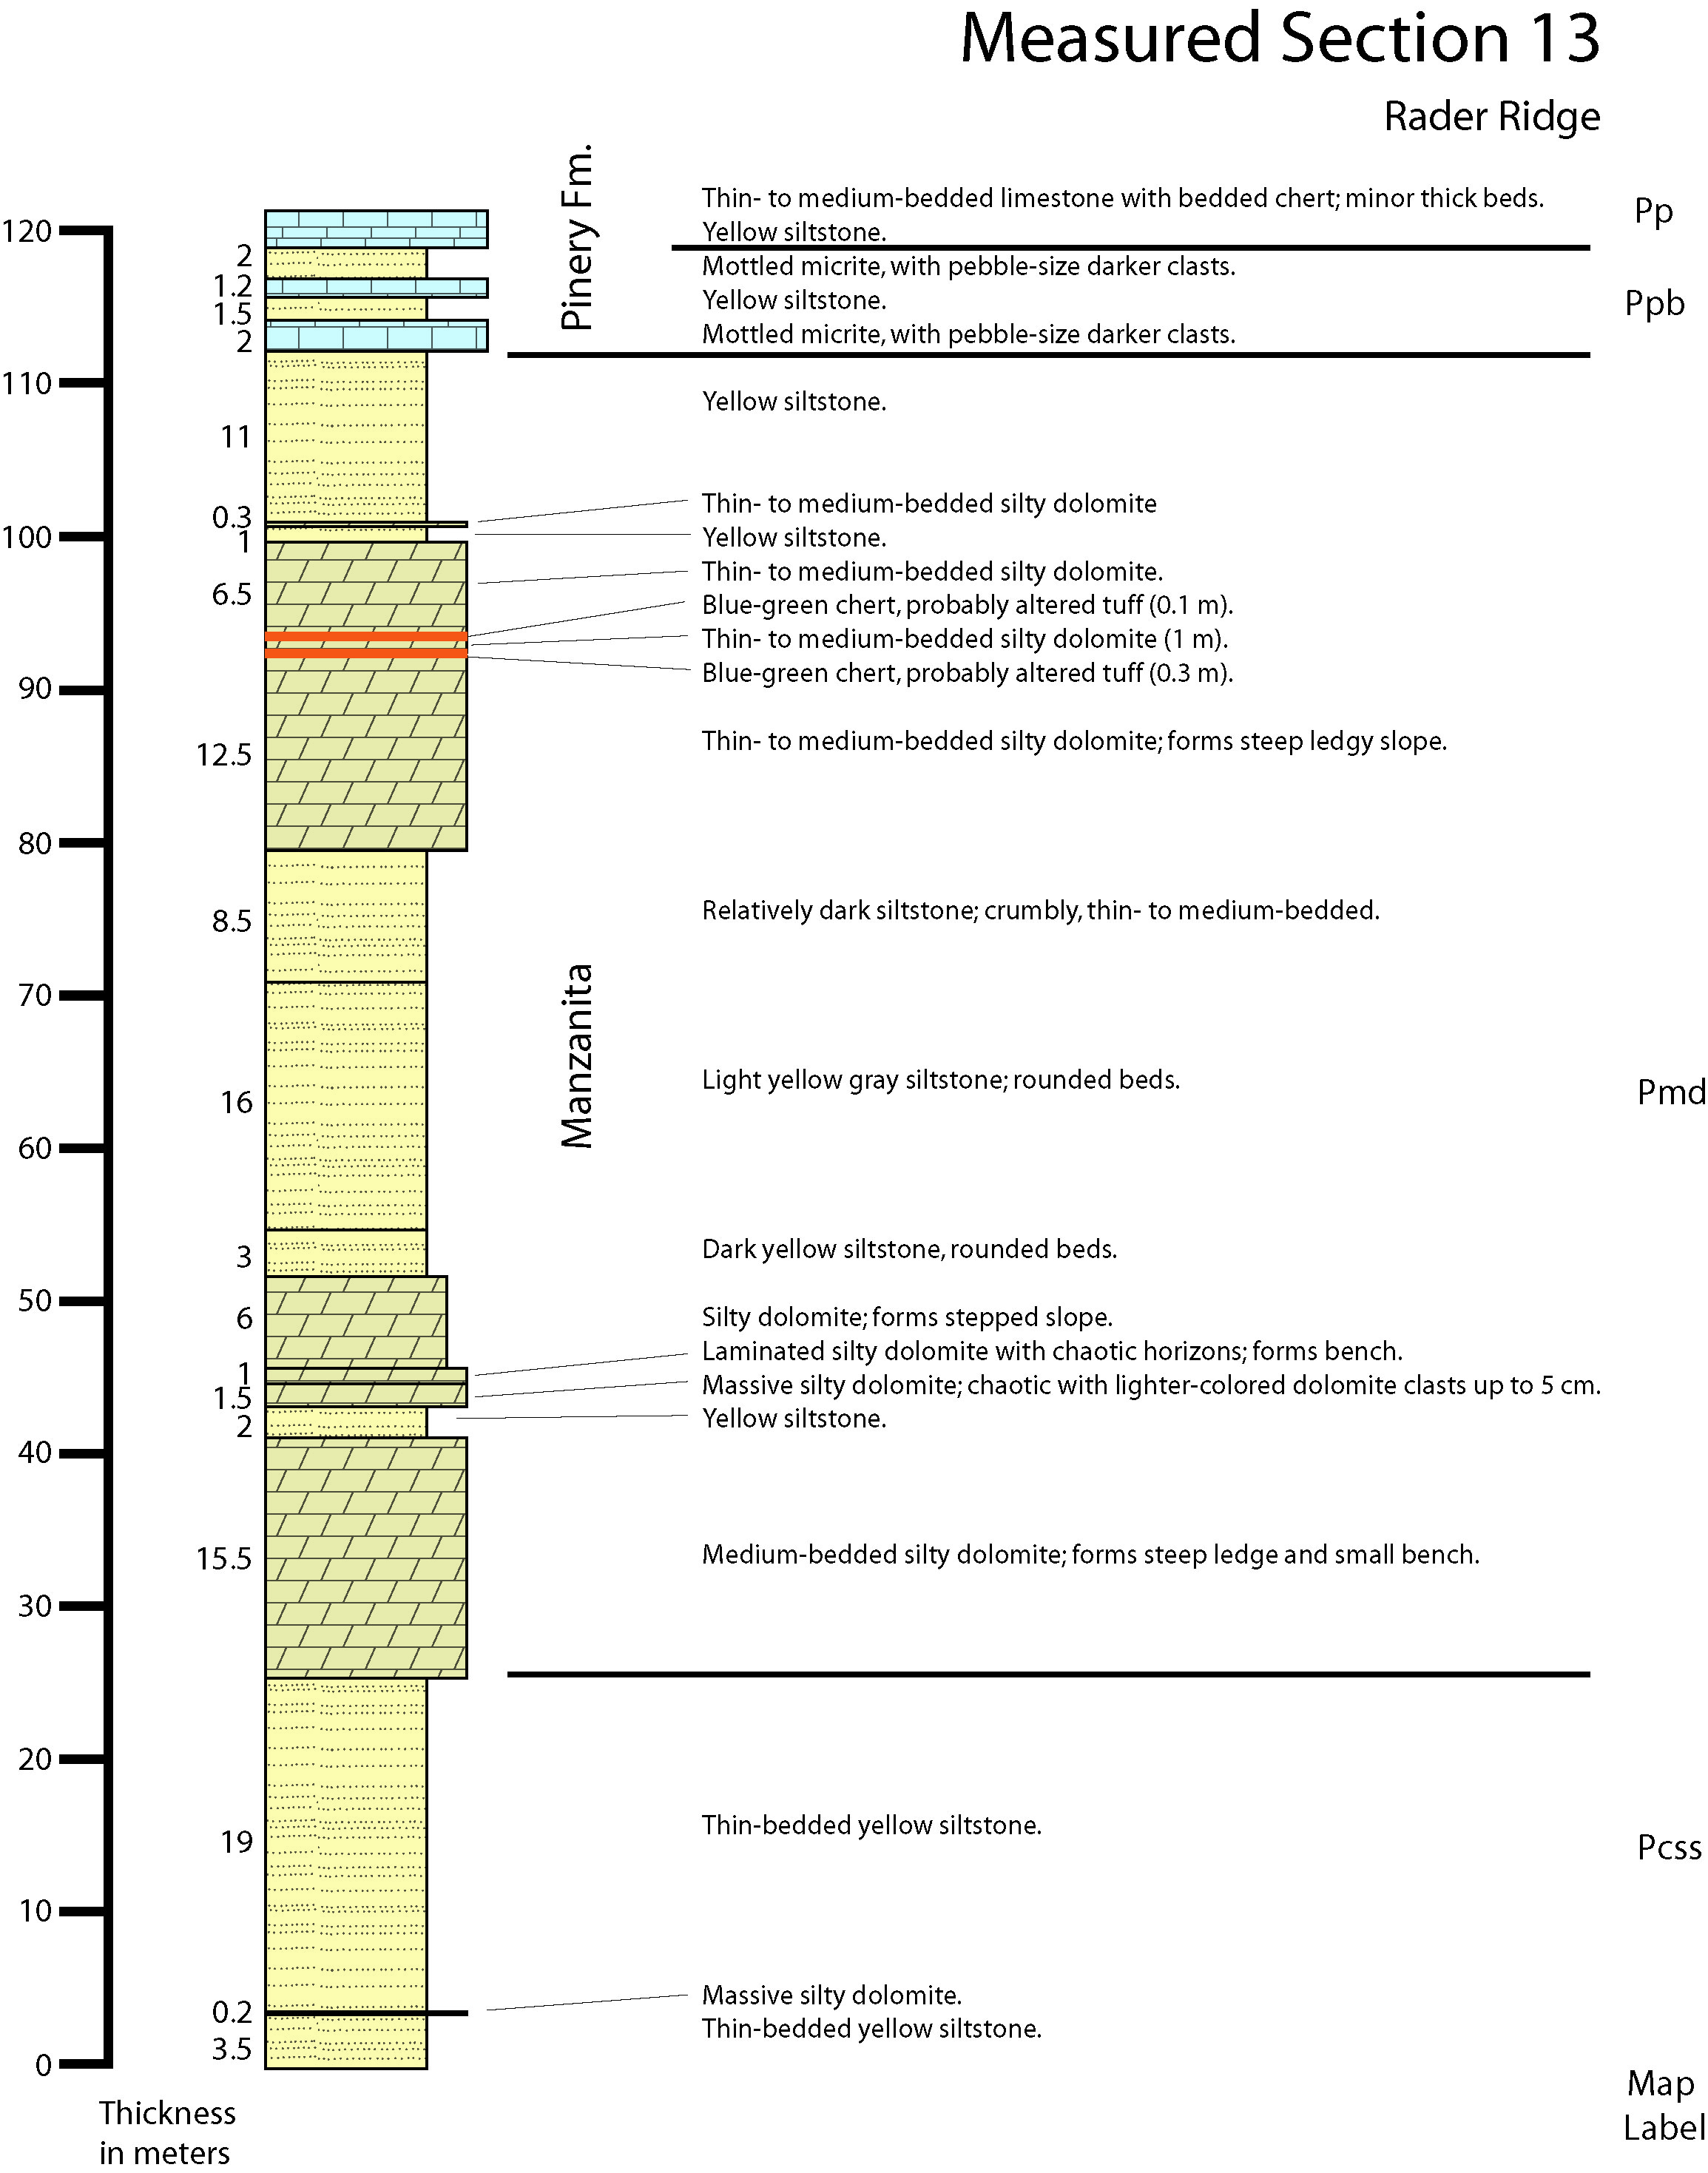
| Measured Section 13.jpg | 913 KB | 09/03/2020 11:13:26 AM |
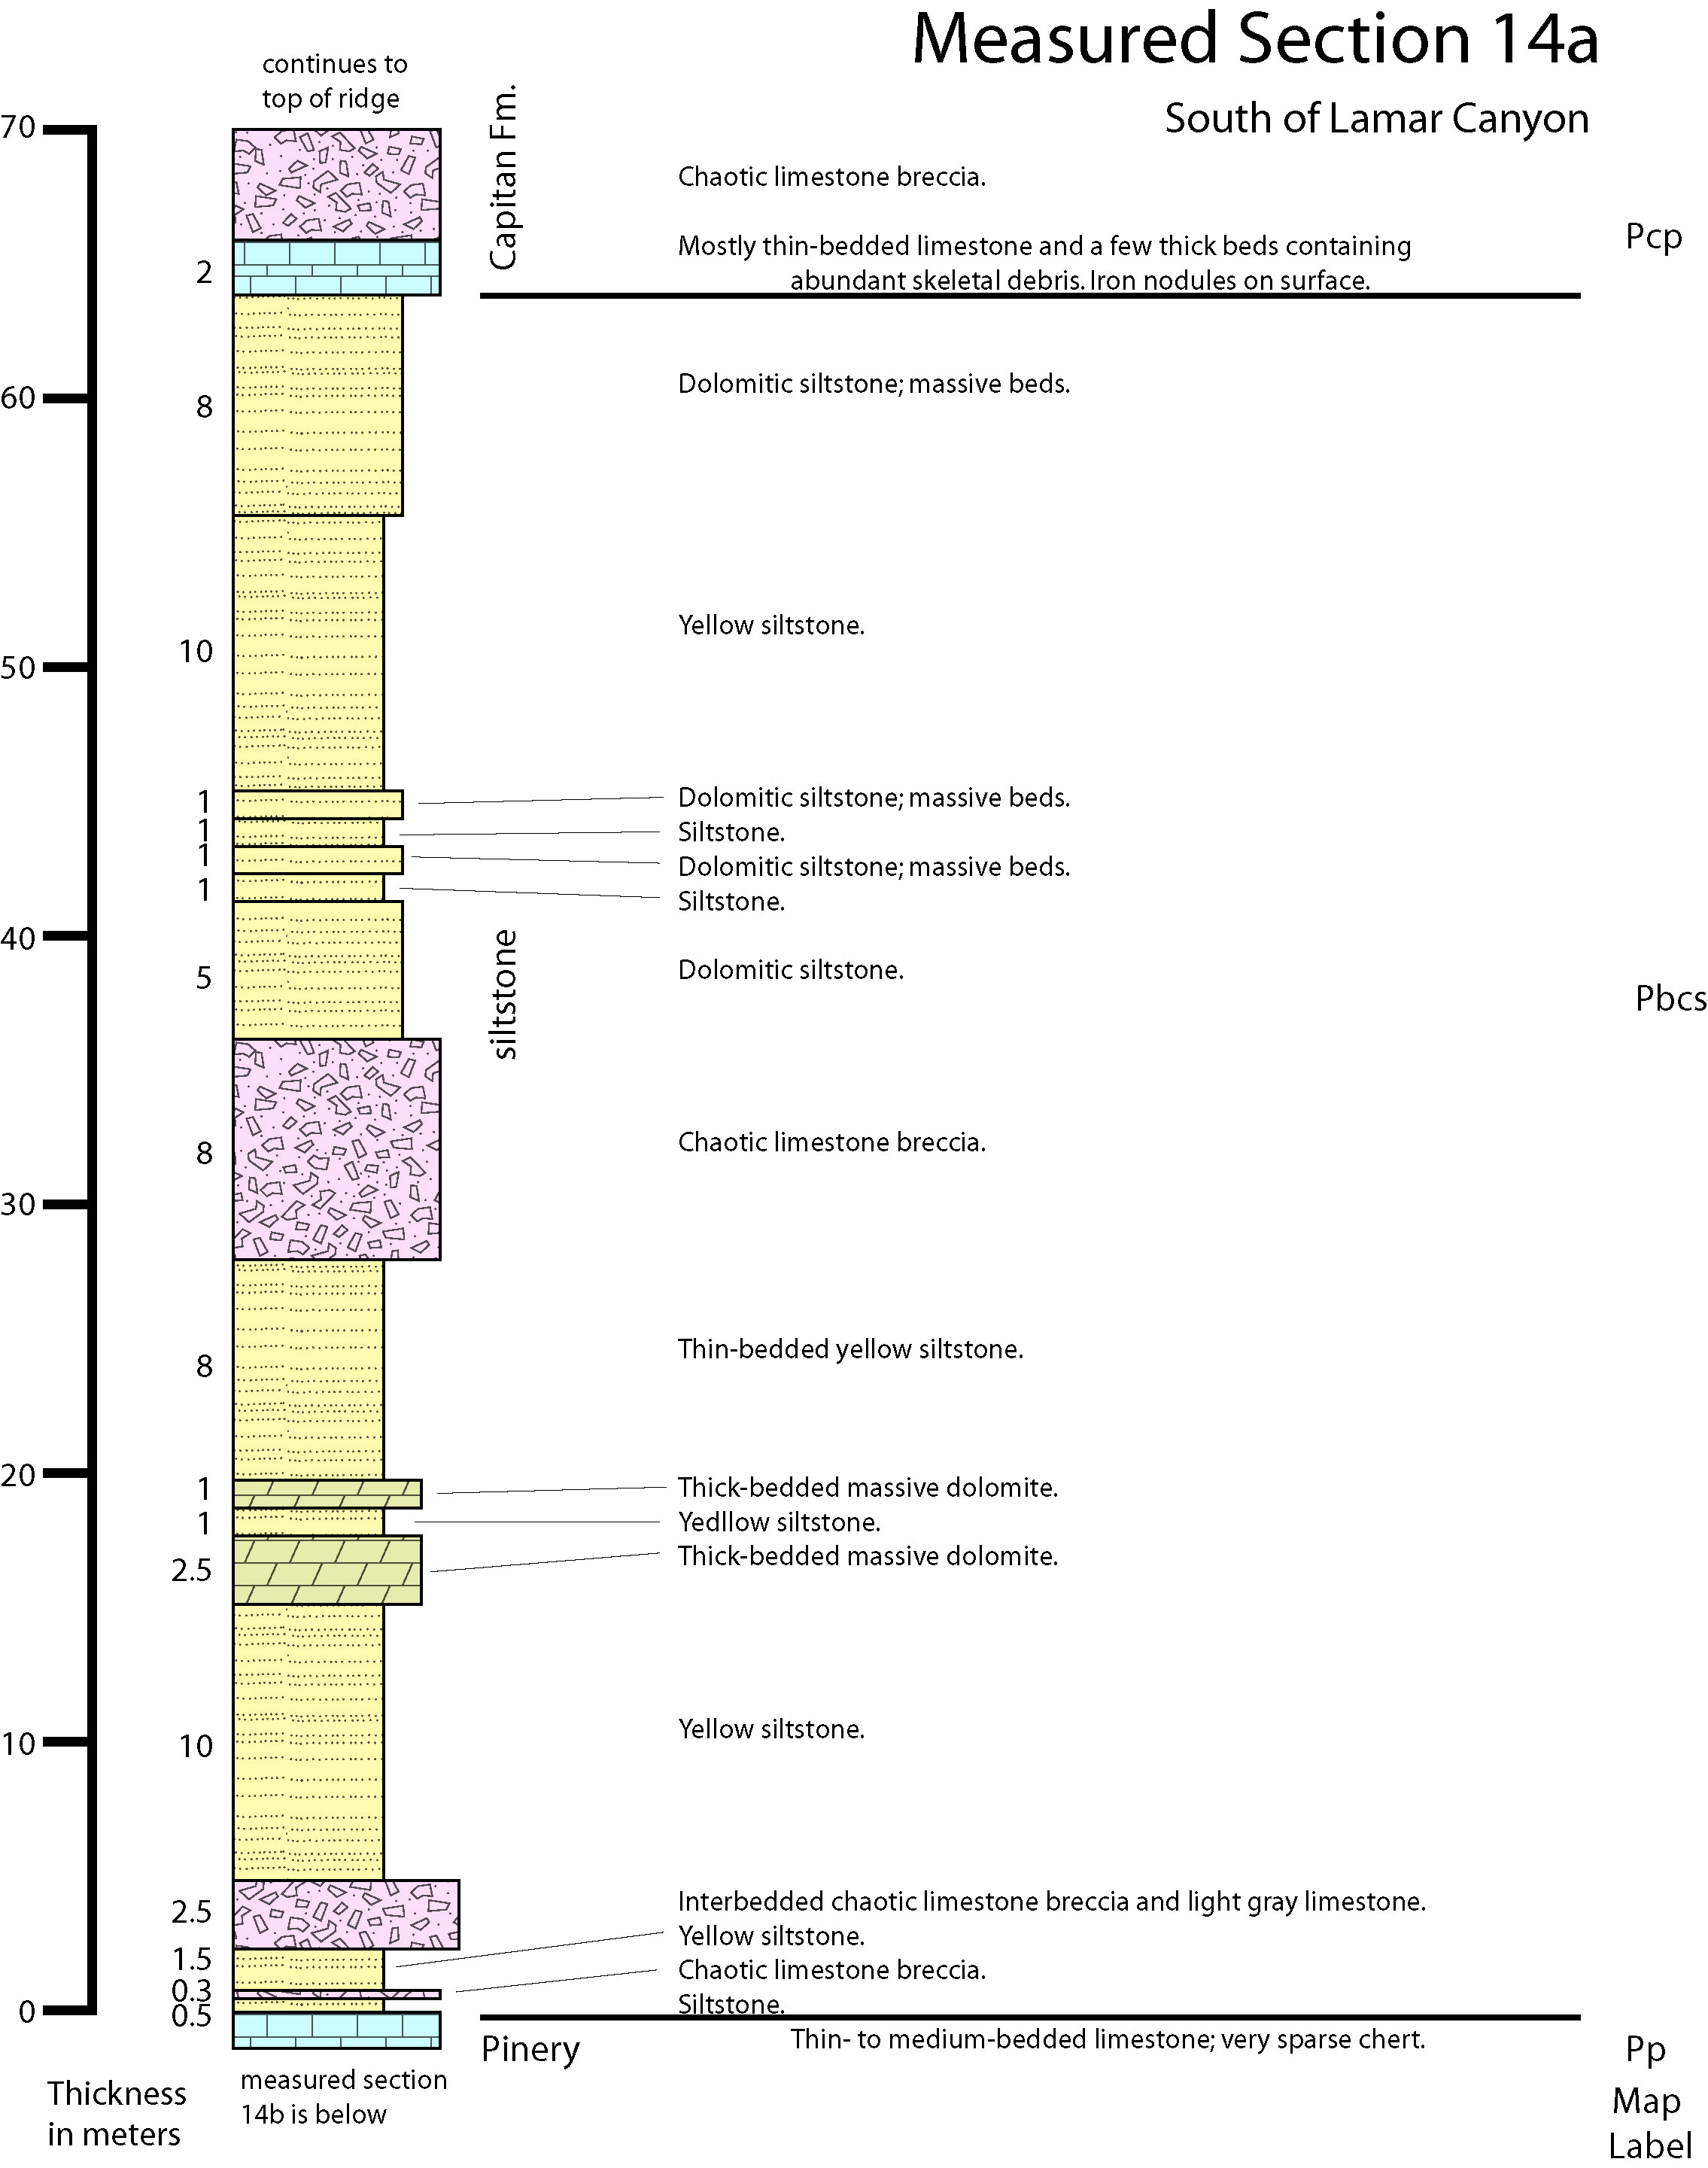
| Measured Section 14a.jpg | 826 KB | 09/03/2020 11:13:28 AM |
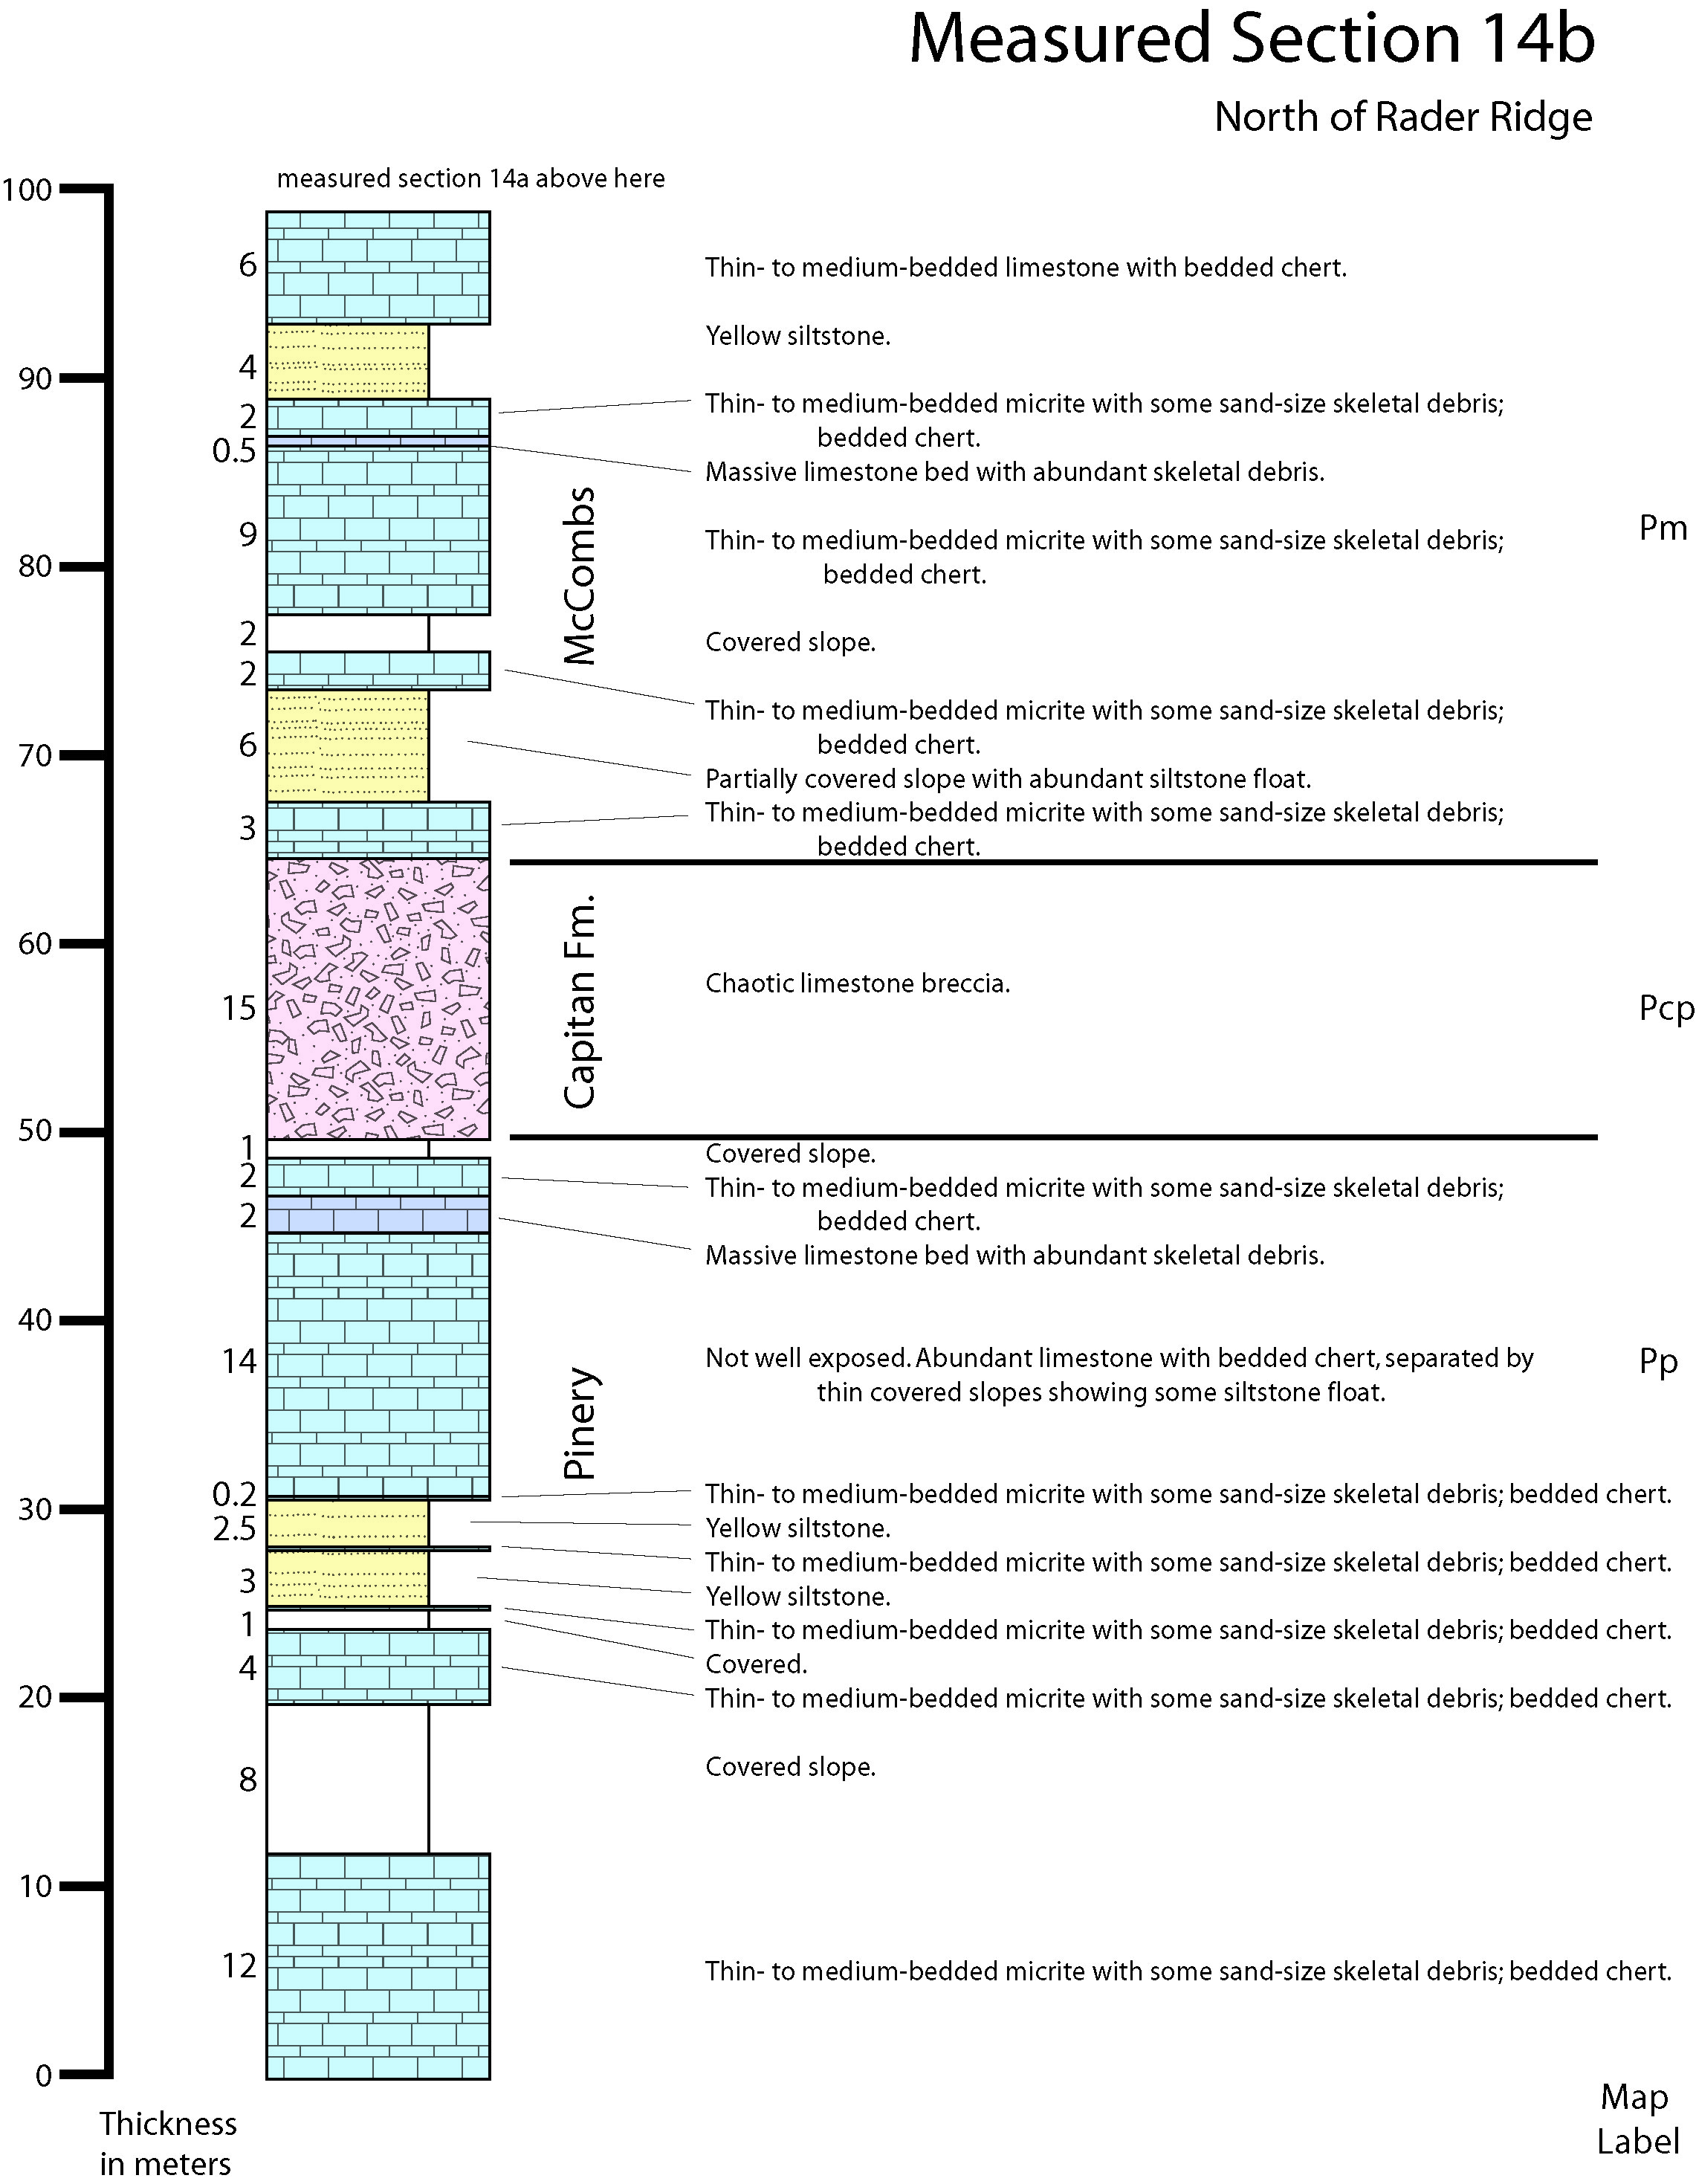
| Measured Section 14b.jpg | 970 KB | 09/03/2020 11:13:26 AM |
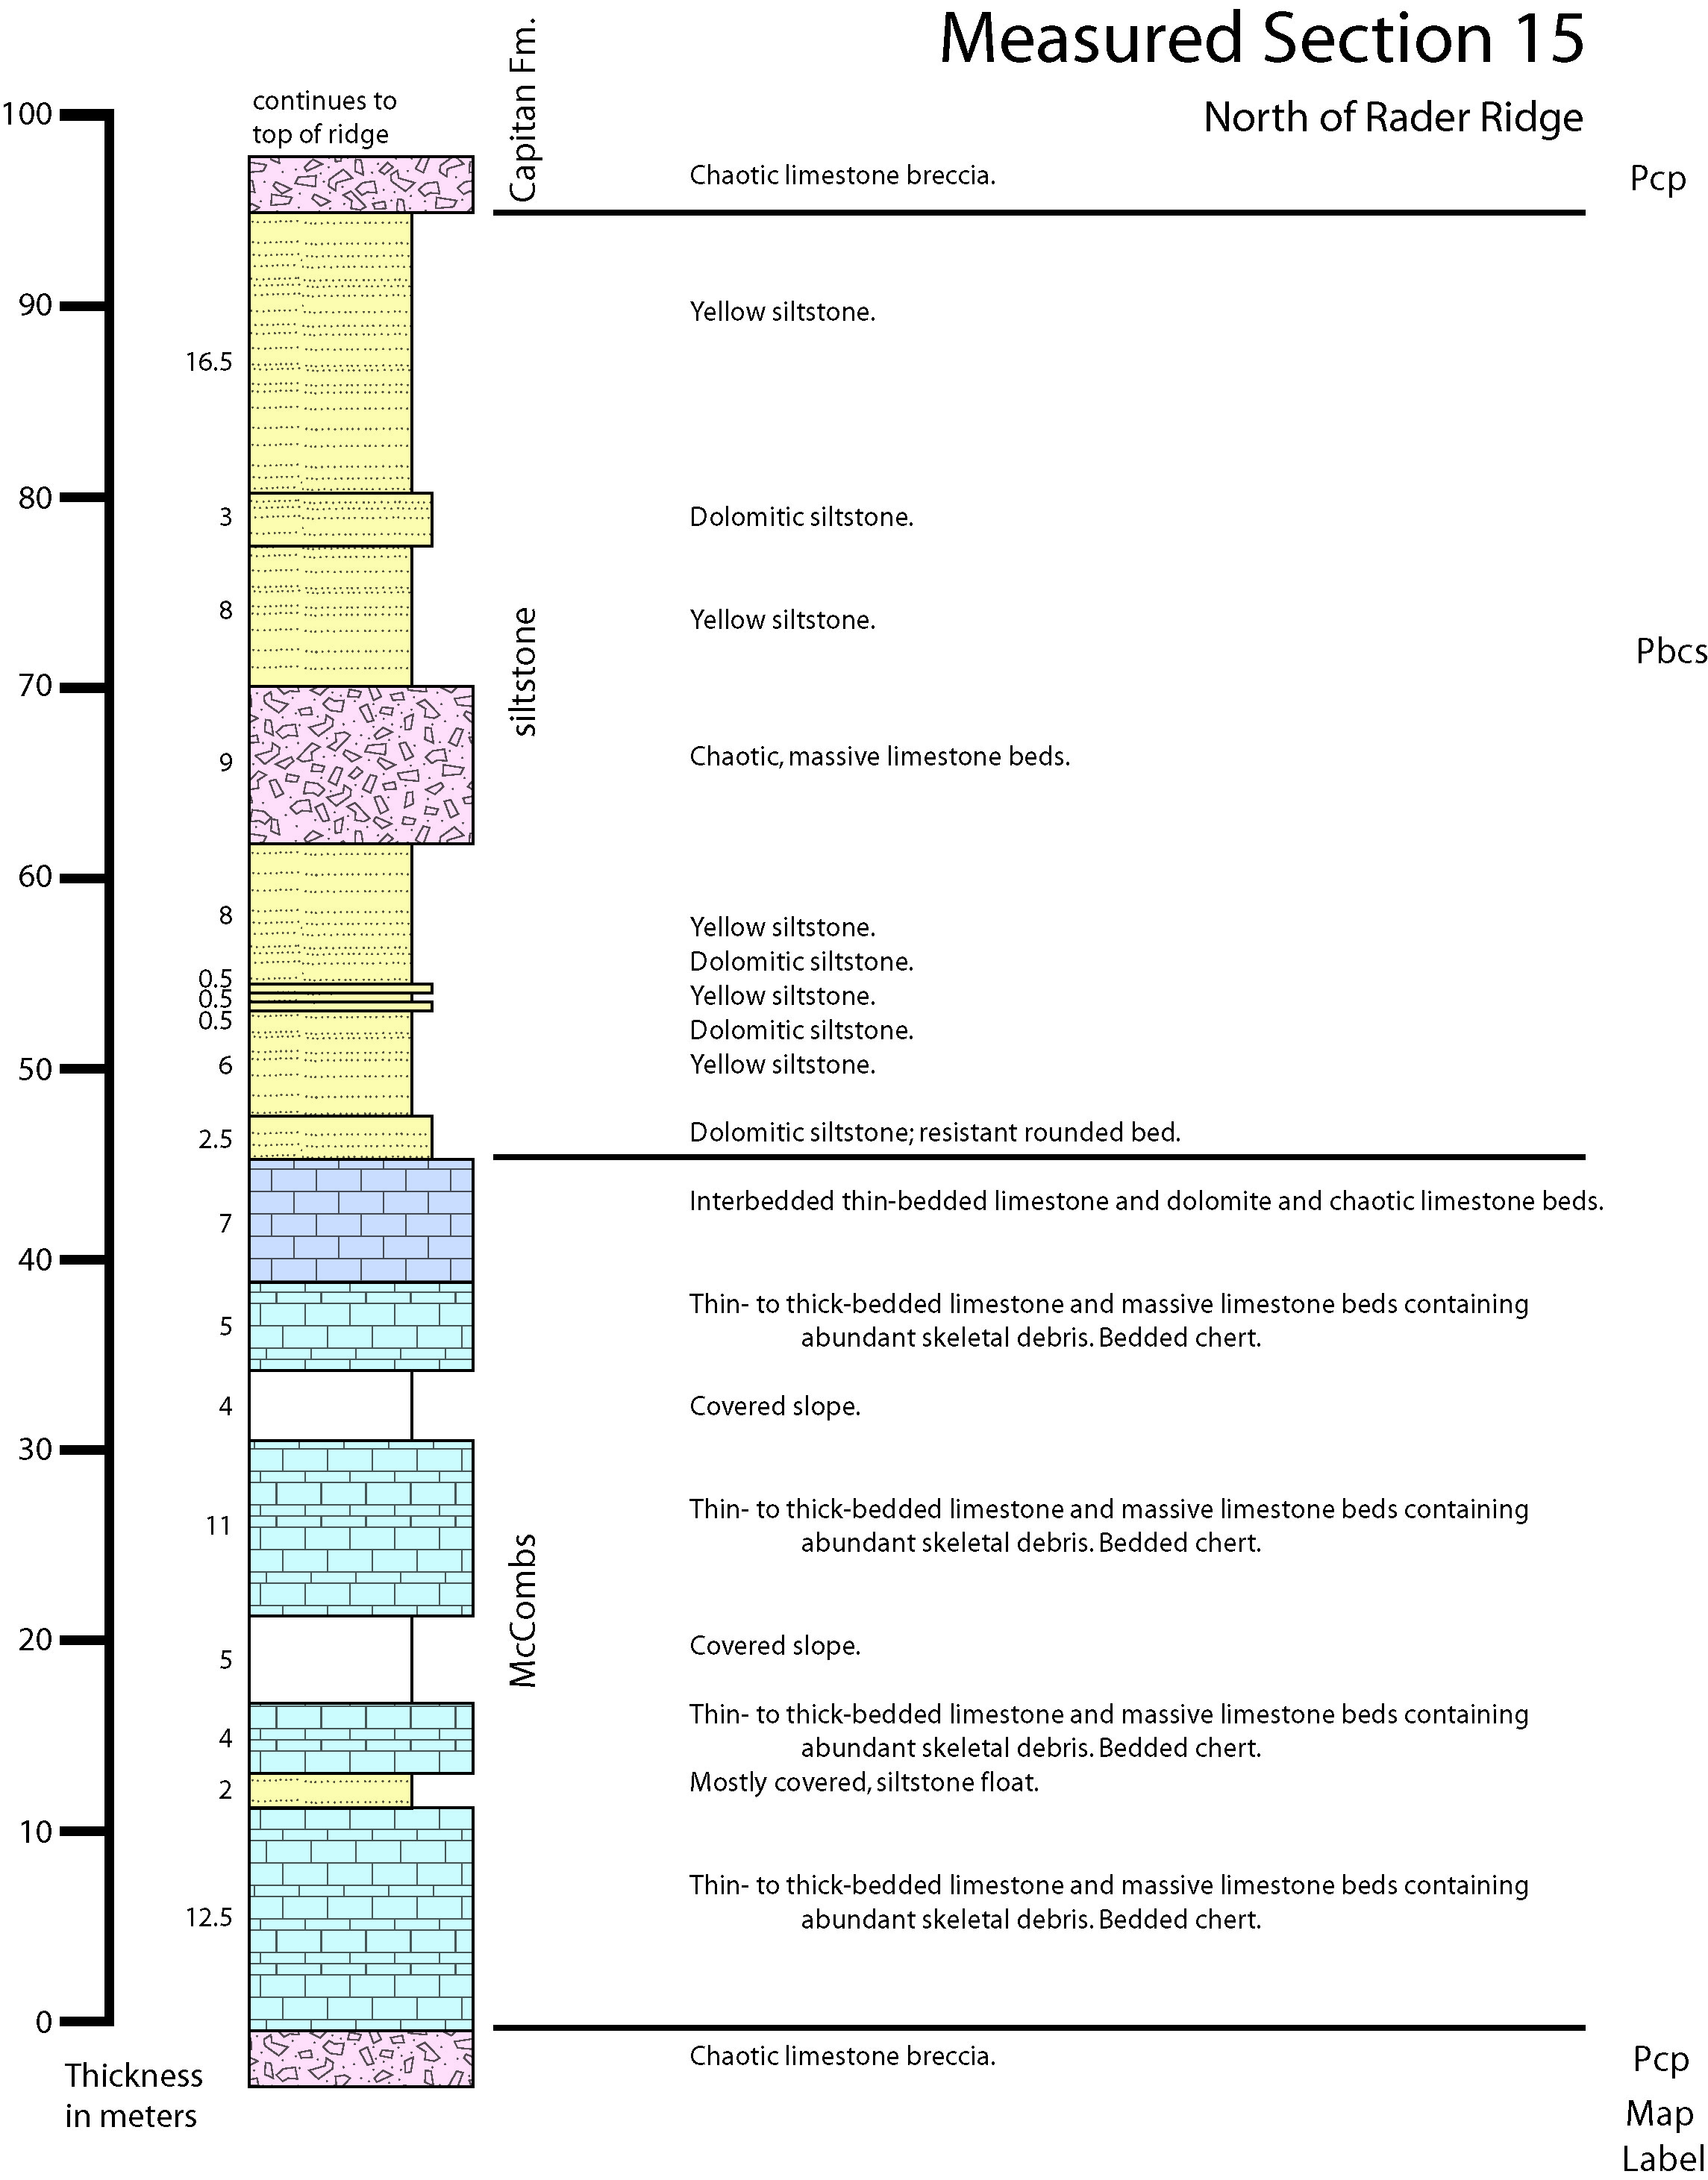
| Measured Section 15.jpg | 850 KB | 09/03/2020 11:13:26 AM |
| Measured Section 16.jpg | 890 KB | 09/03/2020 11:13:26 AM |
| Measured Section 17.jpg | 899 KB | 09/03/2020 11:13:26 AM |
| Measured Section 18 and 19.jpg | 972 KB | 09/03/2020 11:13:26 AM |
| Measured Section 2.jpg | 738 KB | 09/03/2020 11:13:28 AM |
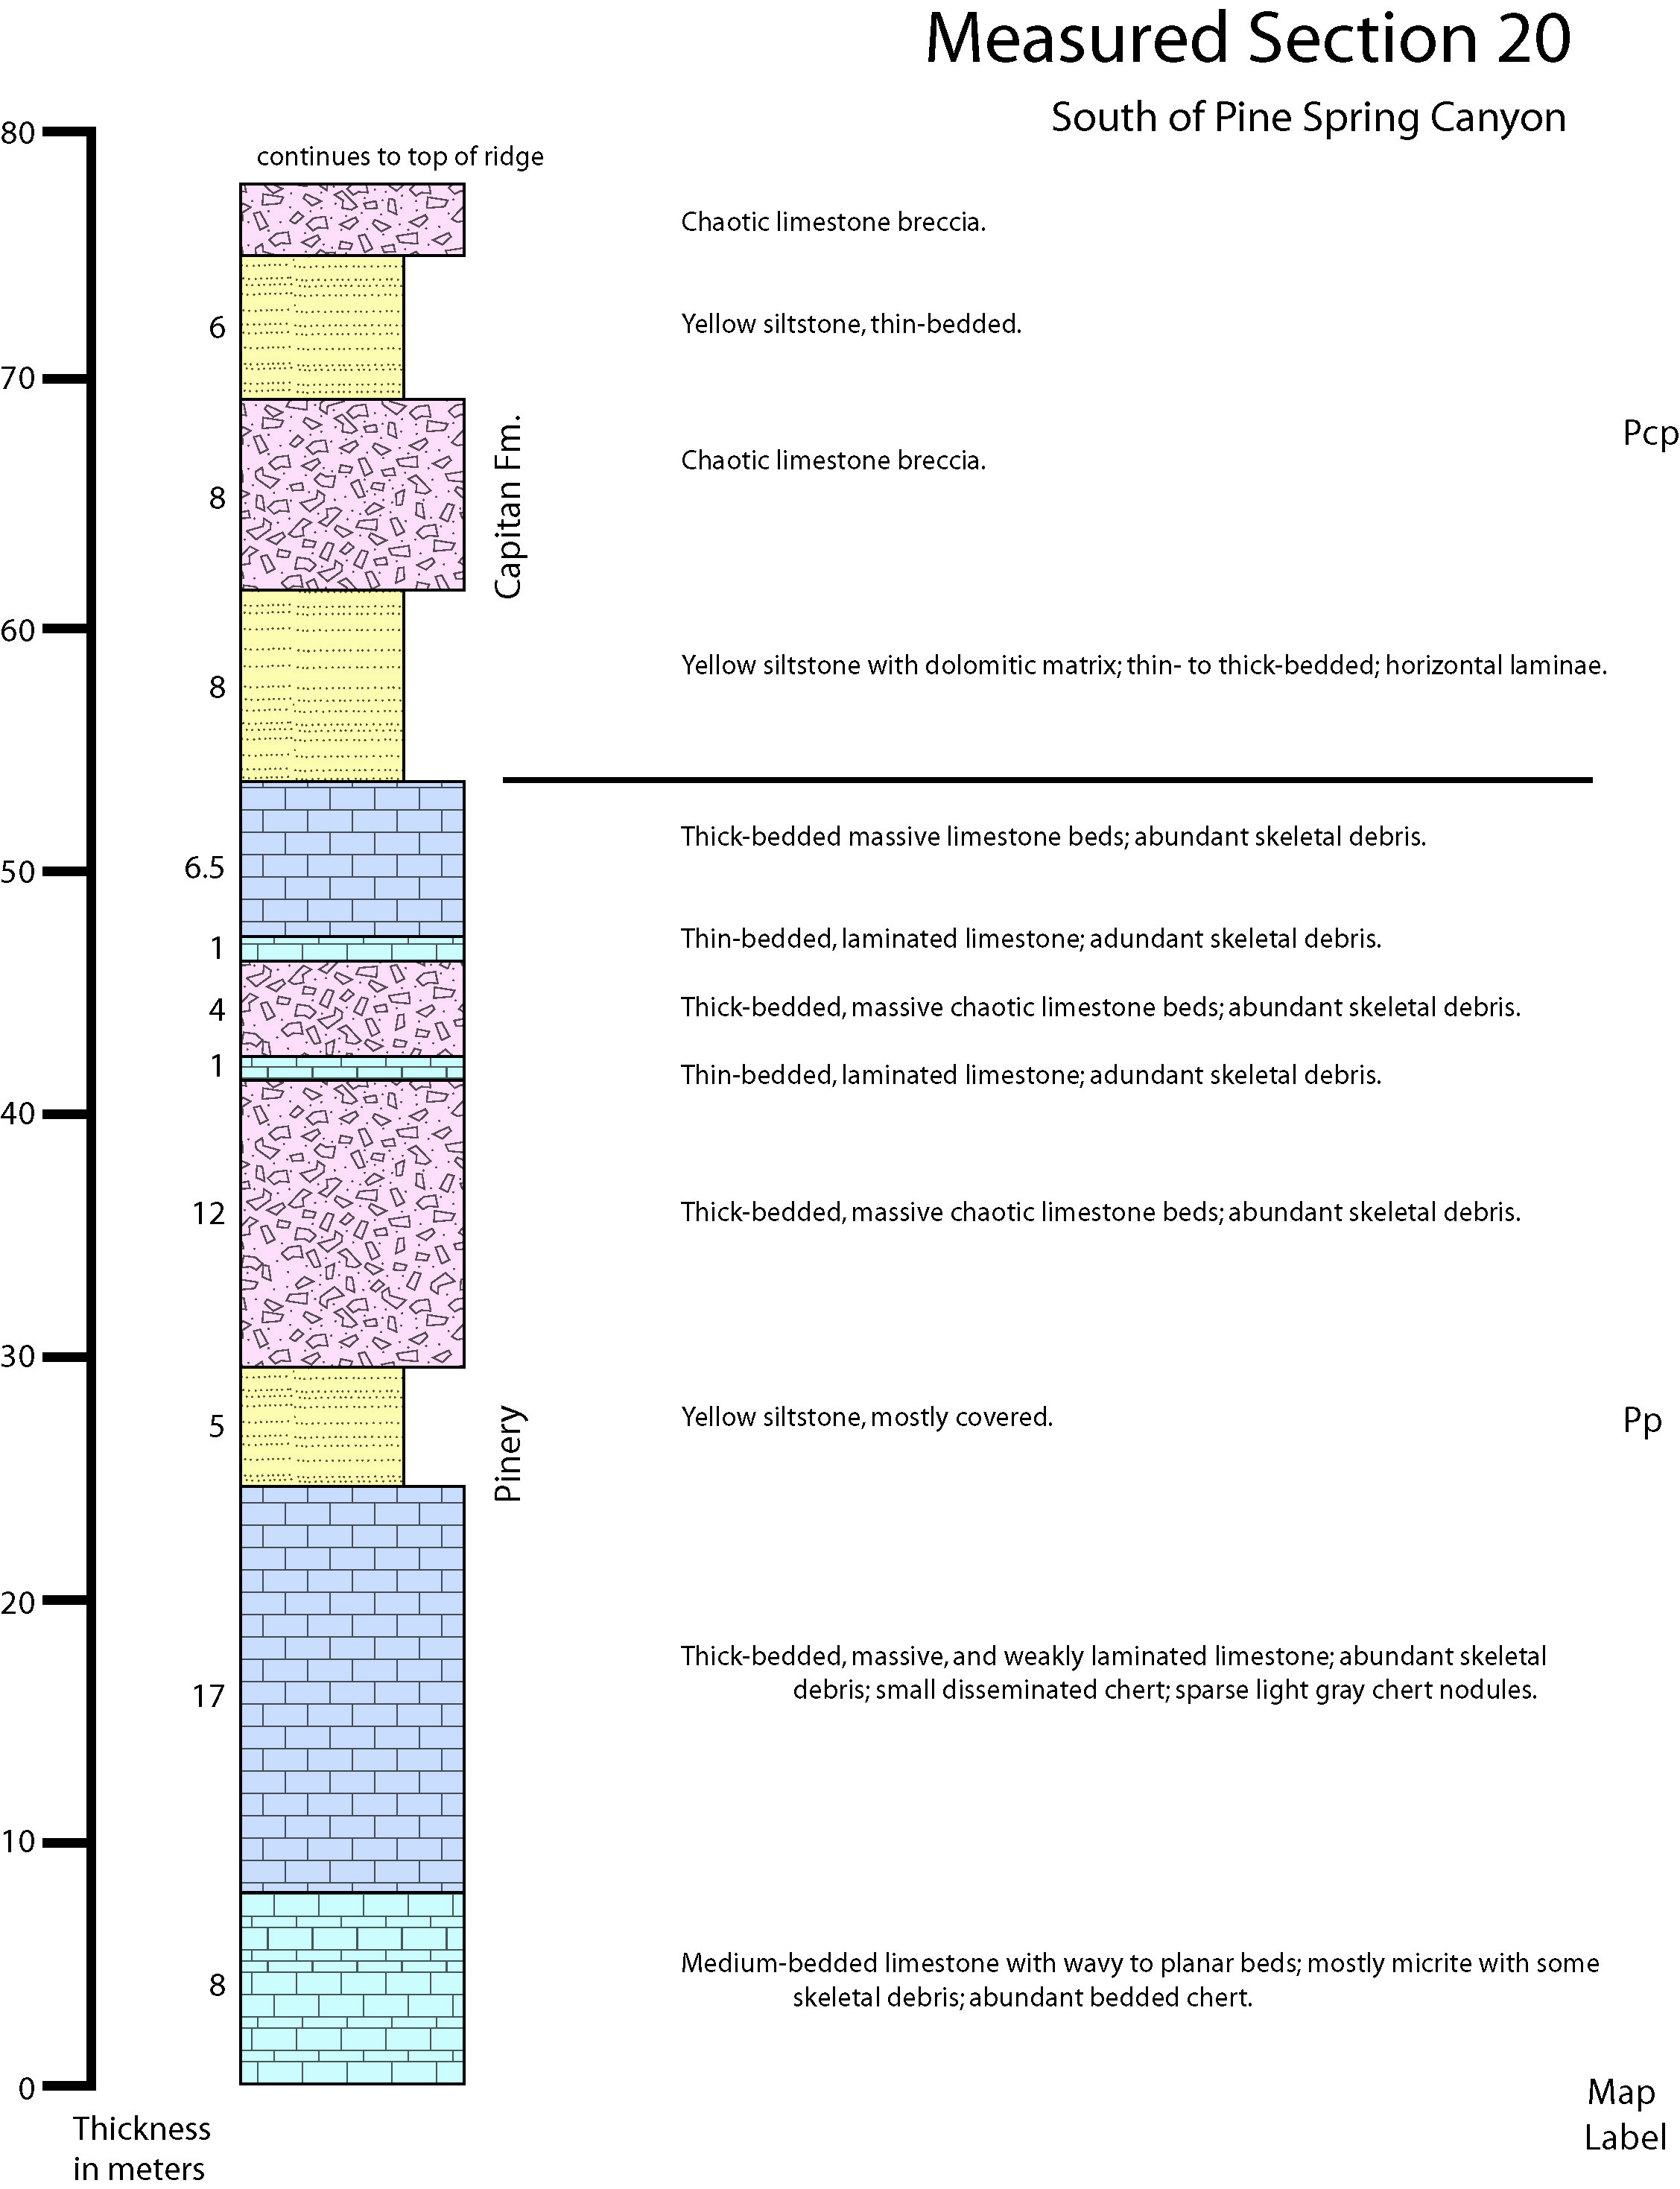
| Measured Section 20.jpg | 852 KB | 09/03/2020 11:13:26 AM |
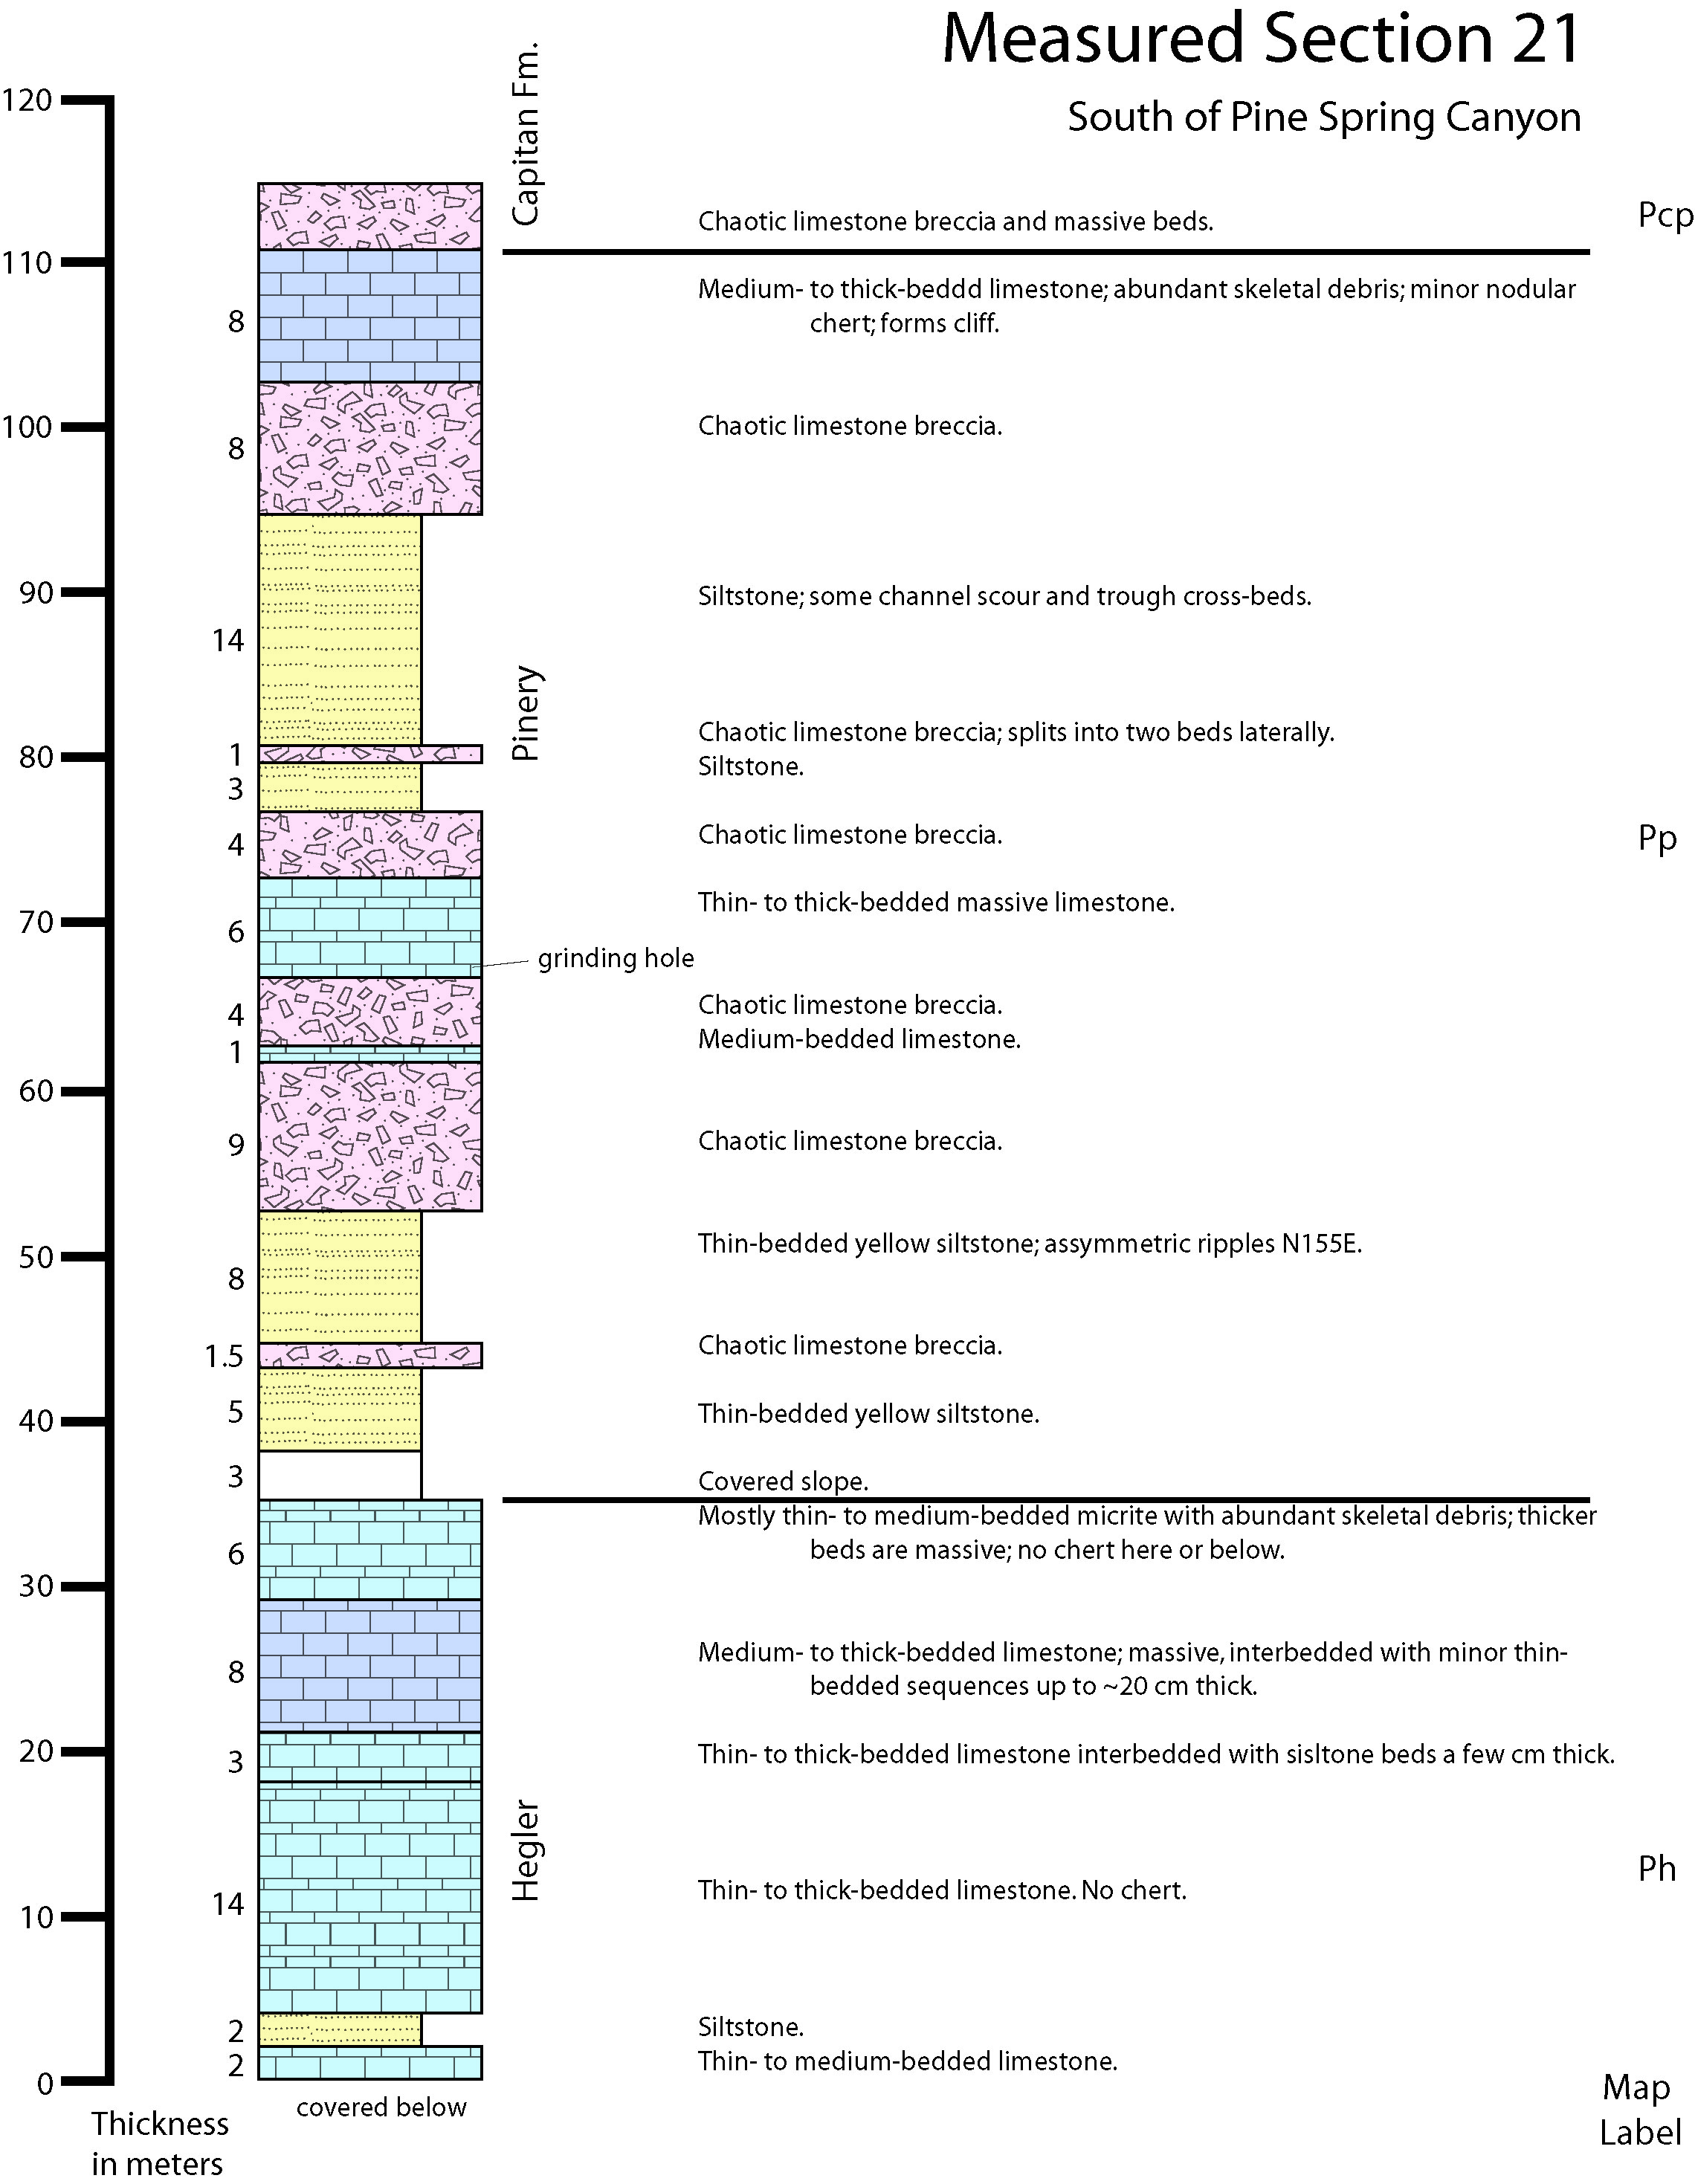
| Measured Section 21.jpg | 912 KB | 09/03/2020 11:13:26 AM |
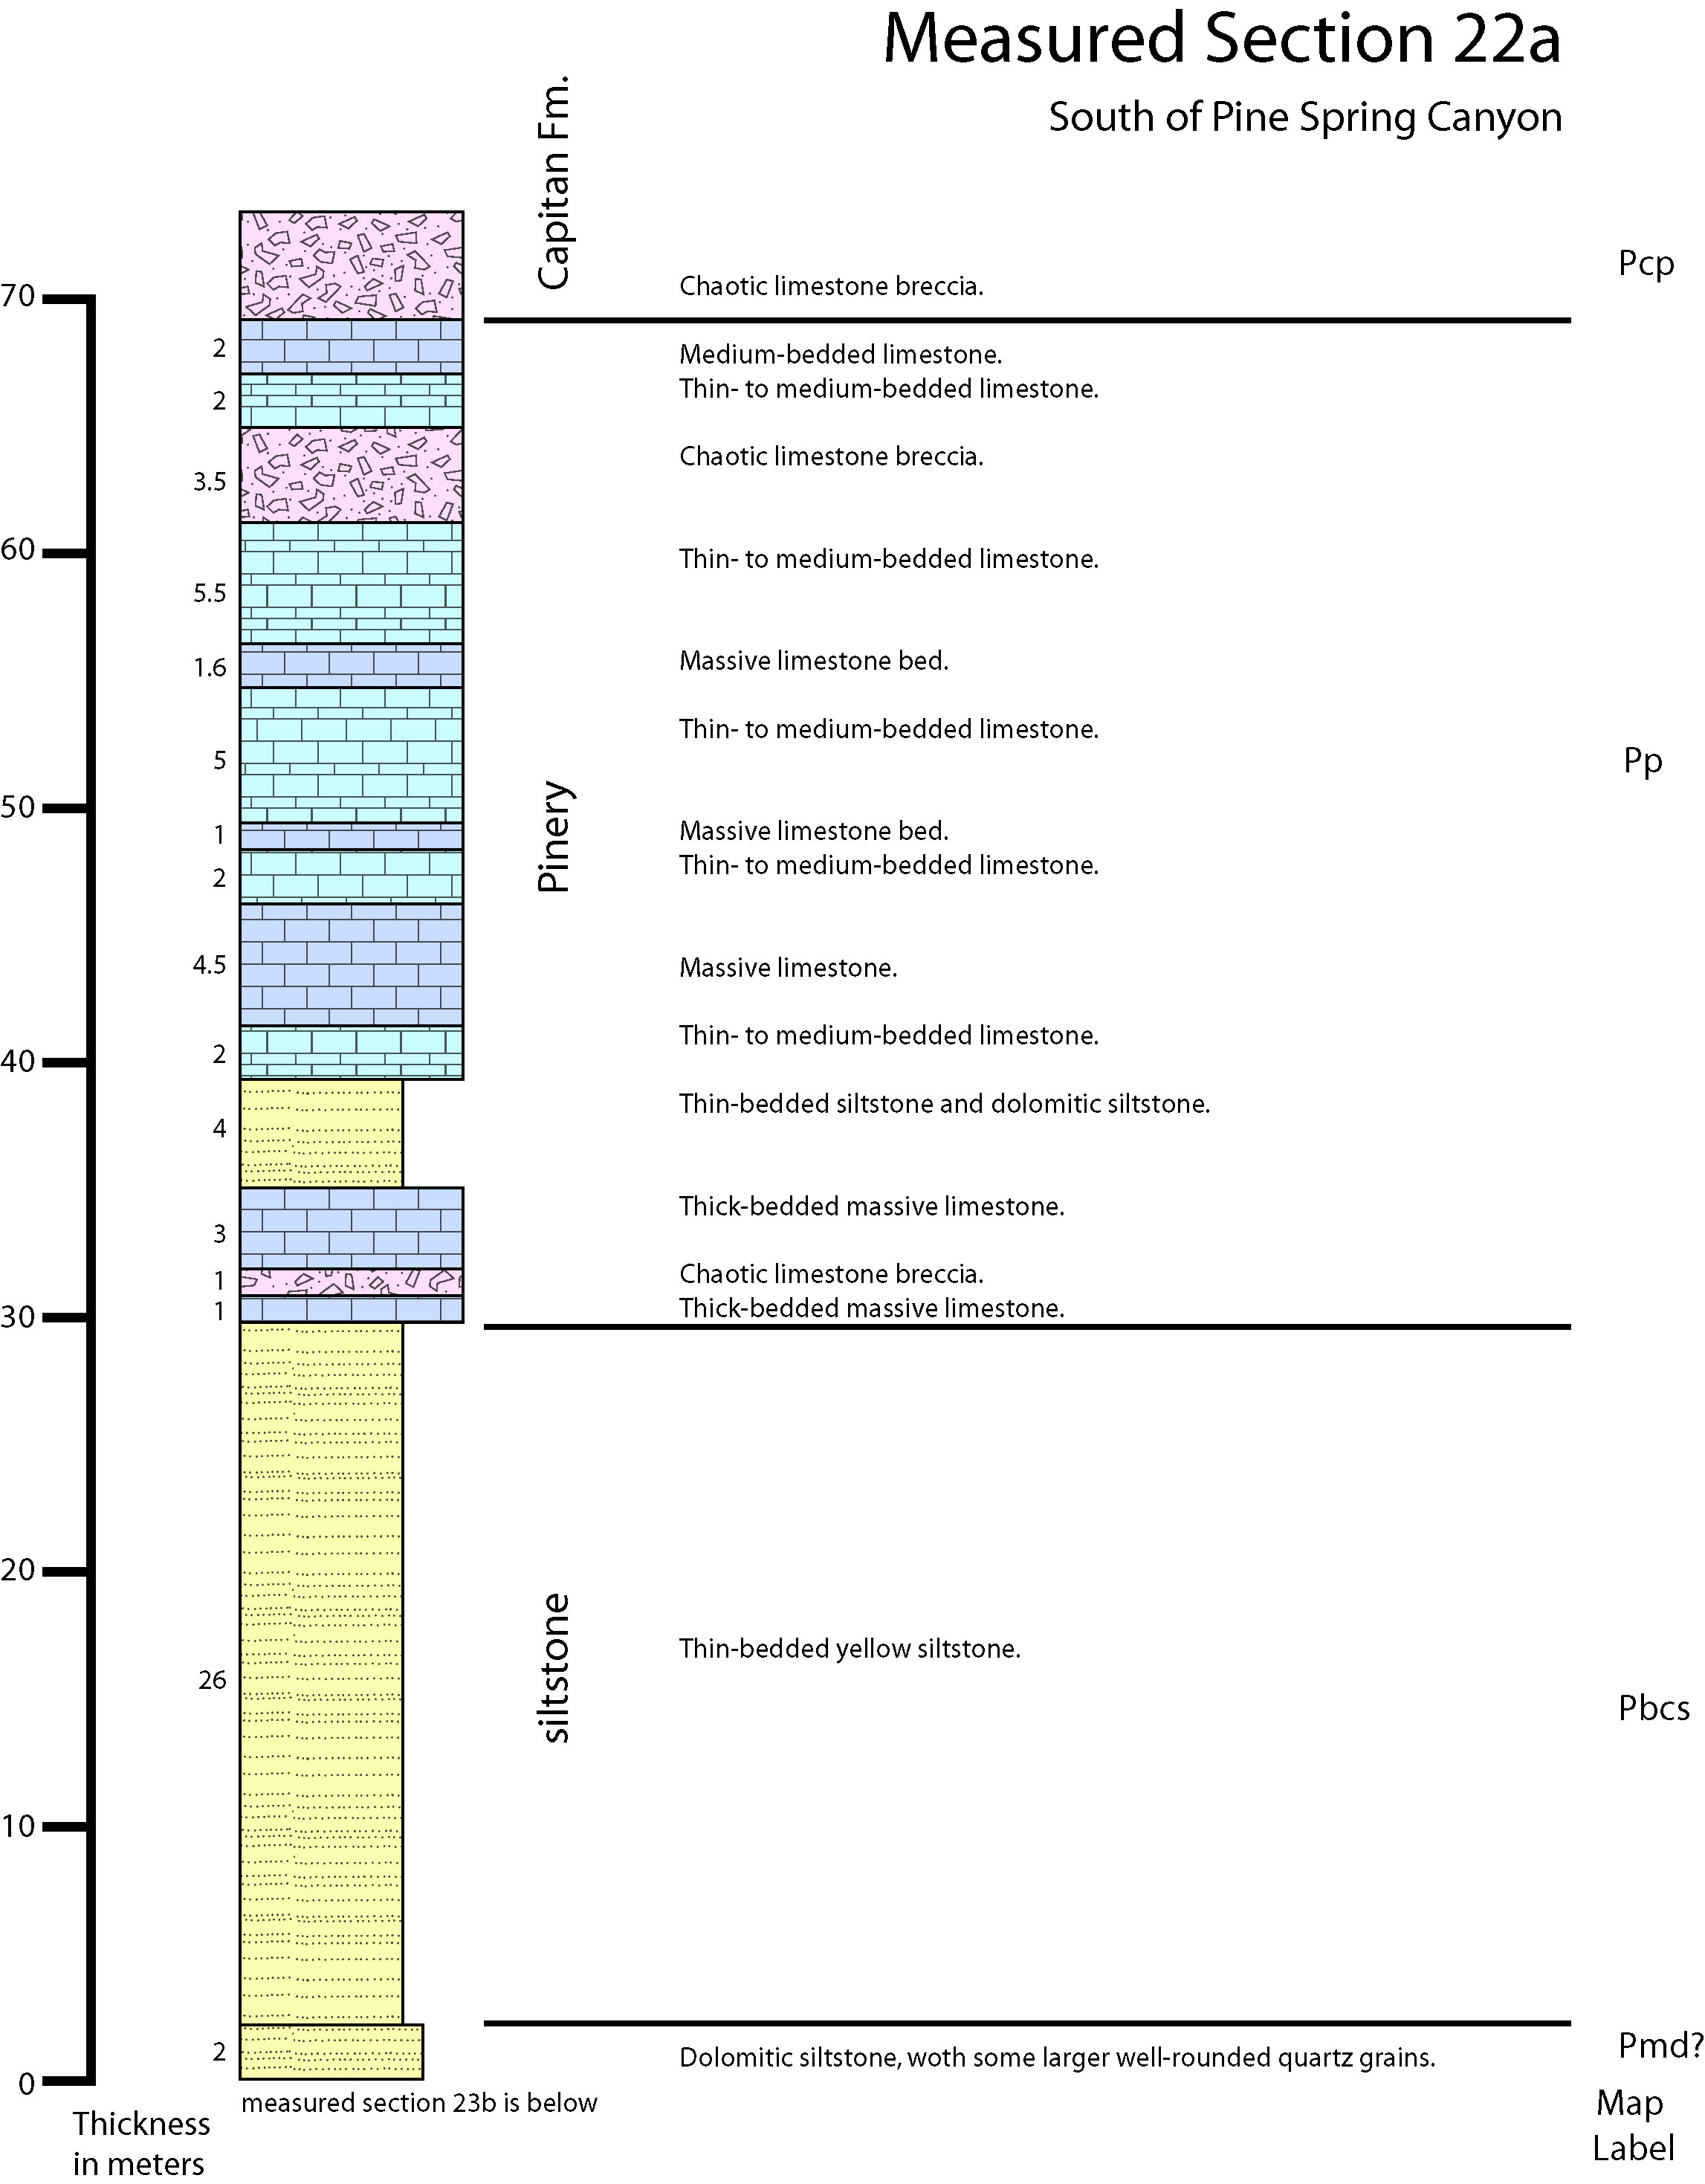
| Measured Section 22a.jpg | 804 KB | 09/03/2020 11:13:26 AM |
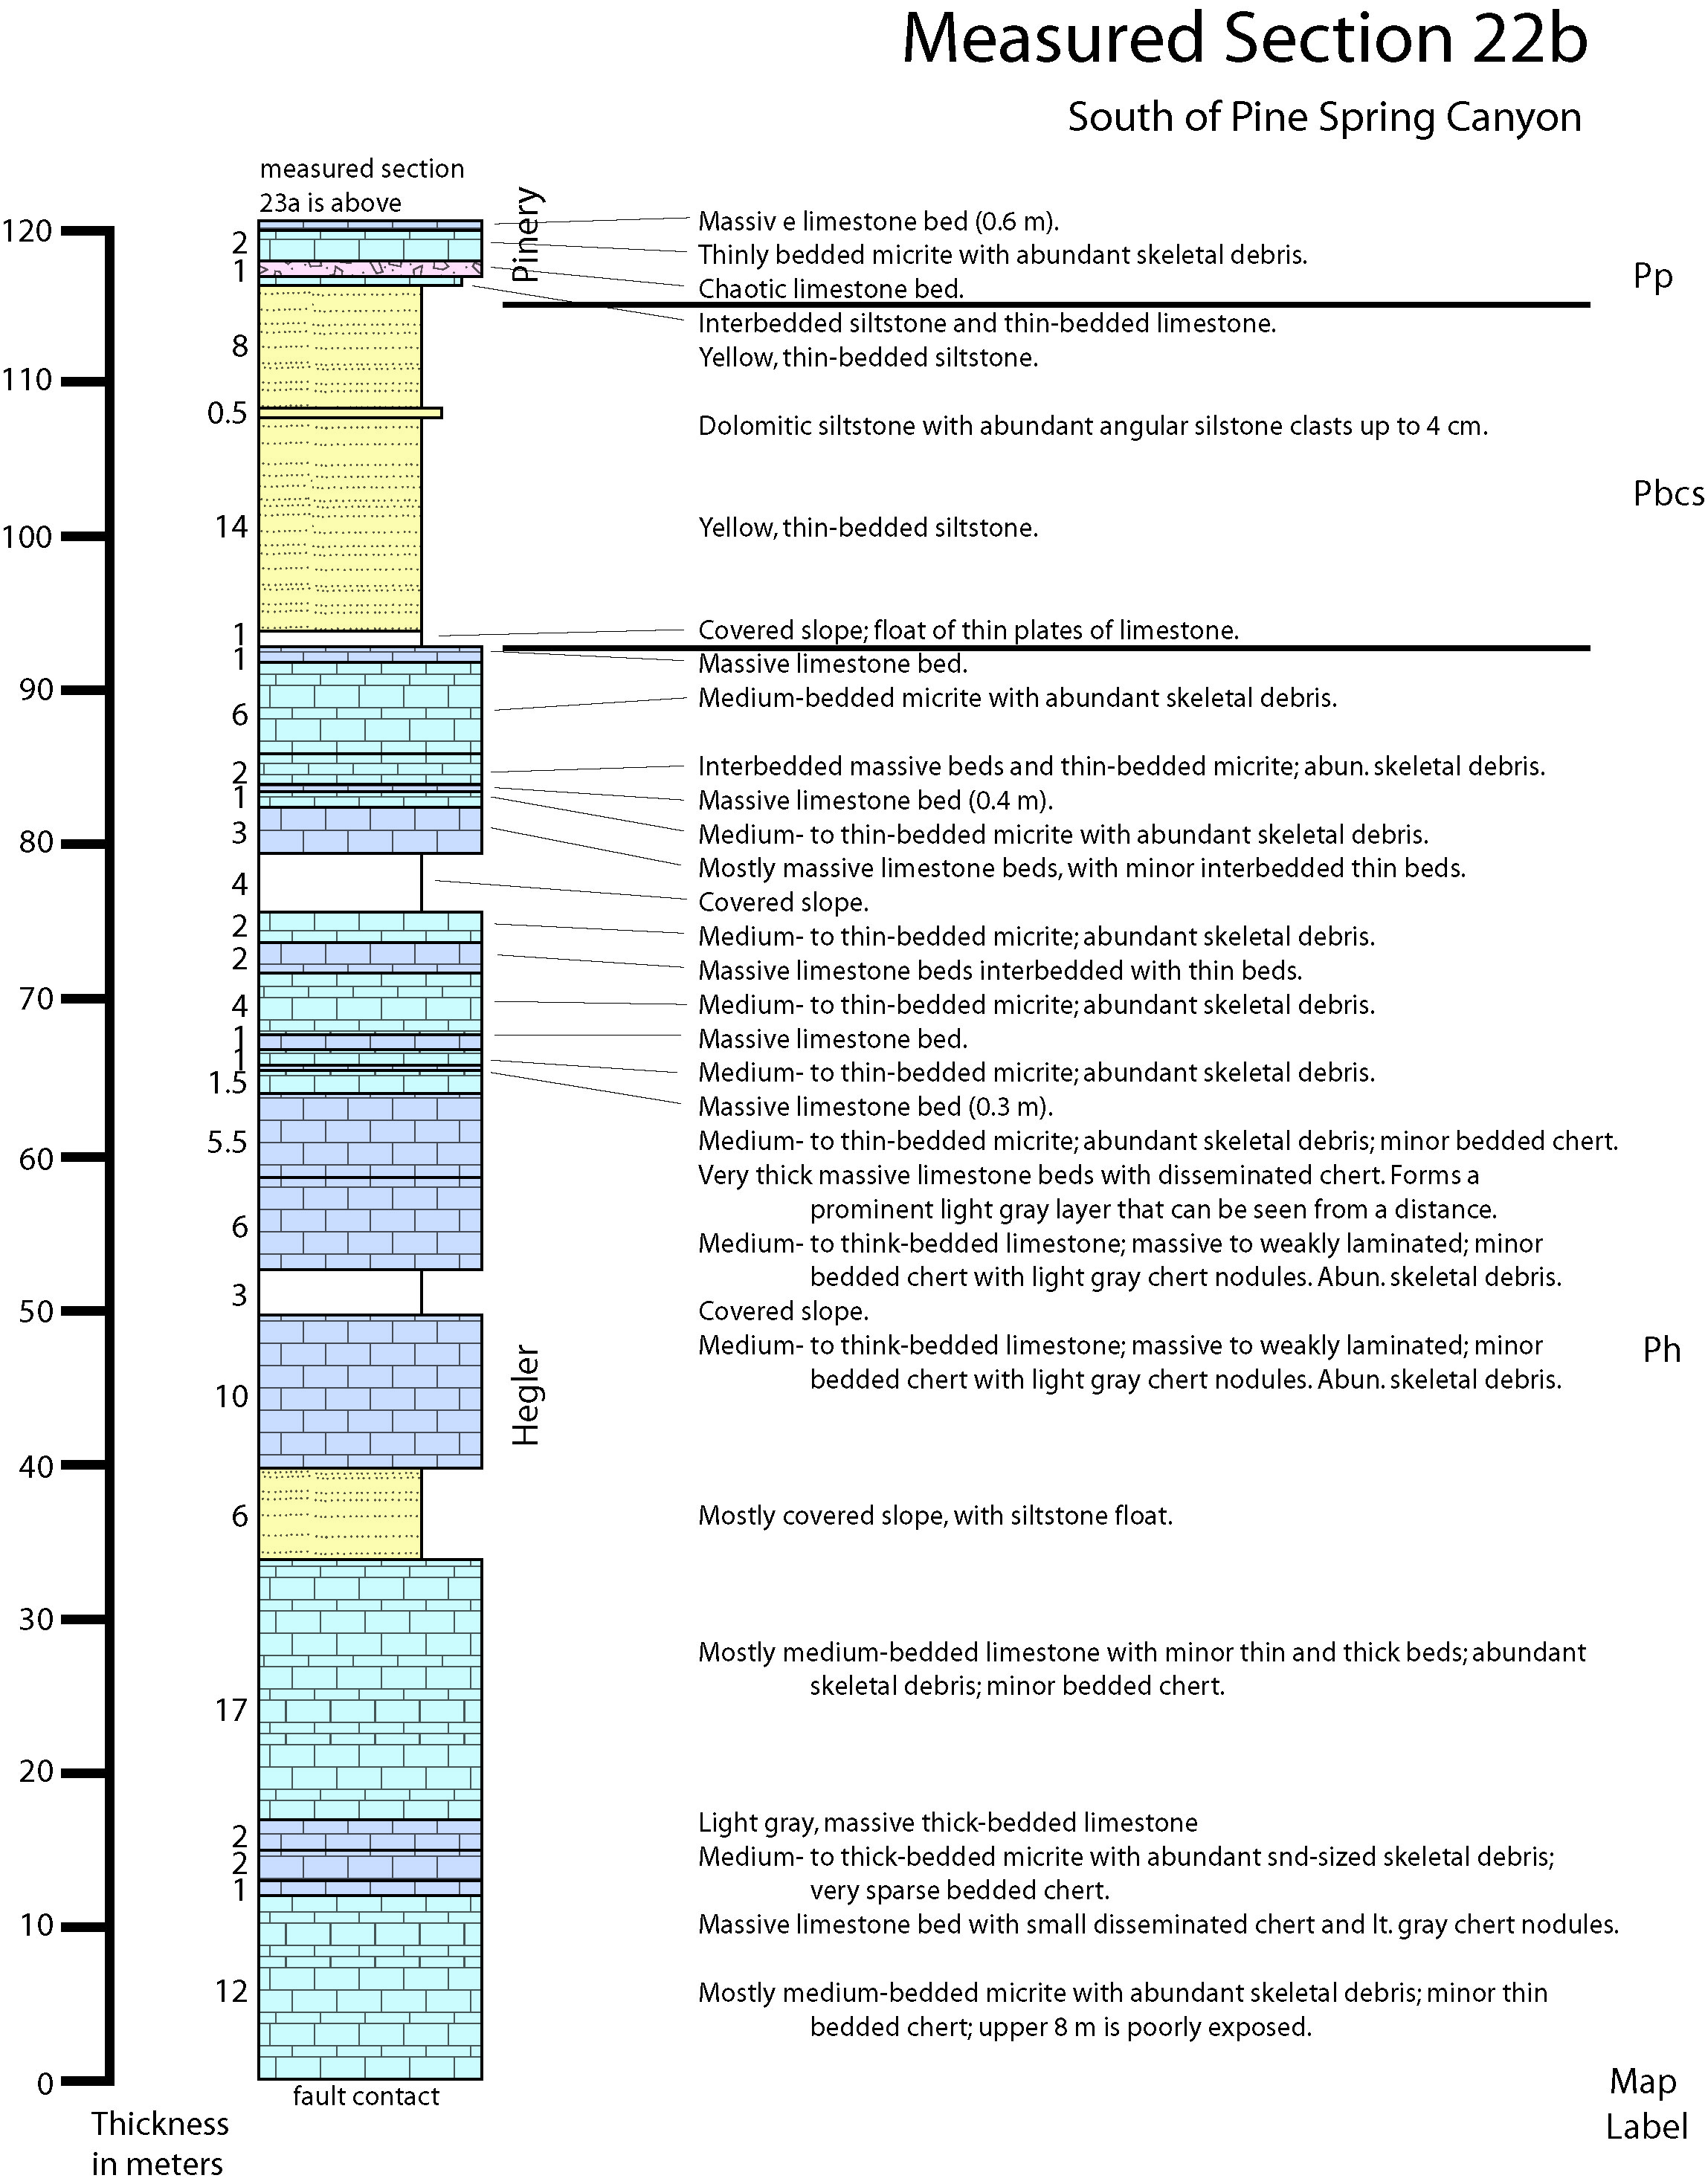
| Measured Section 22b.jpg | 1.12 MB | 09/03/2020 11:13:26 AM |
| Measured Section 23a.jpg | 836 KB | 09/03/2020 11:13:26 AM |
| Measured Section 23b.jpg | 888 KB | 09/03/2020 11:13:26 AM |
| Measured Section 23c.jpg | 1.14 MB | 09/03/2020 11:13:28 AM |
| Measured Section 24.jpg | 1.18 MB | 09/03/2020 11:13:26 AM |
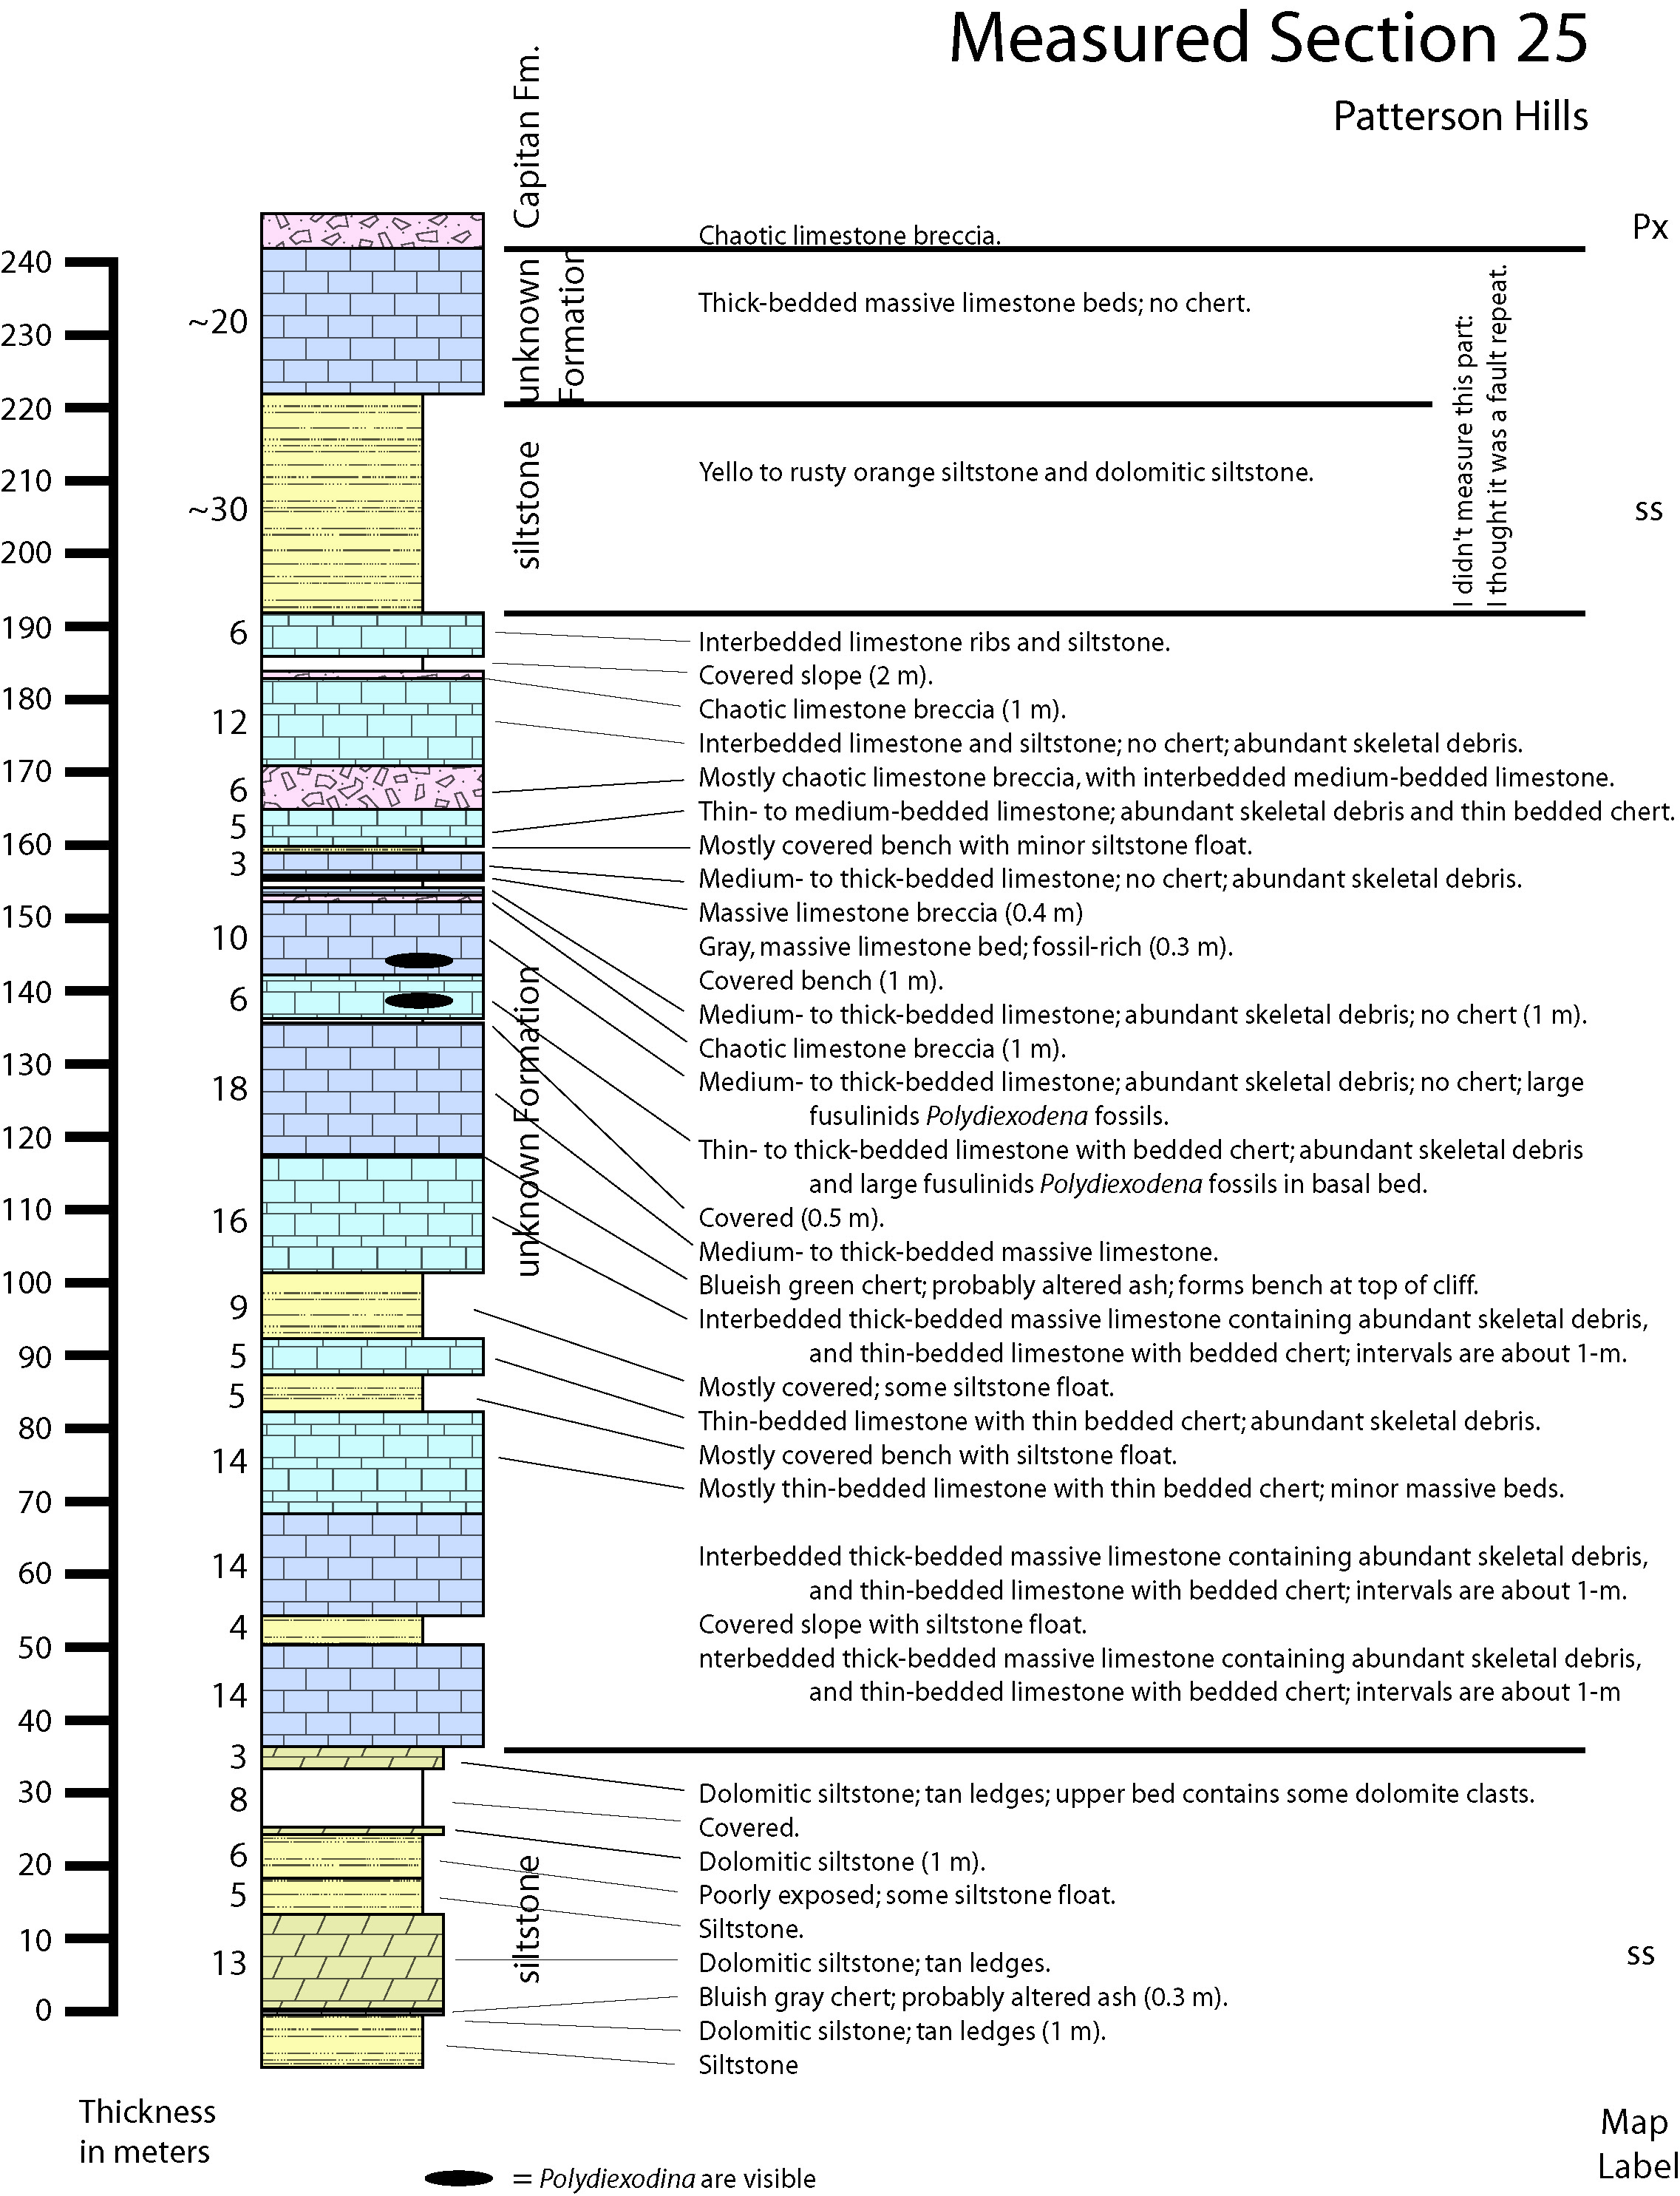
| Measured Section 25.jpg | 1.40 MB | 09/03/2020 11:13:28 AM |
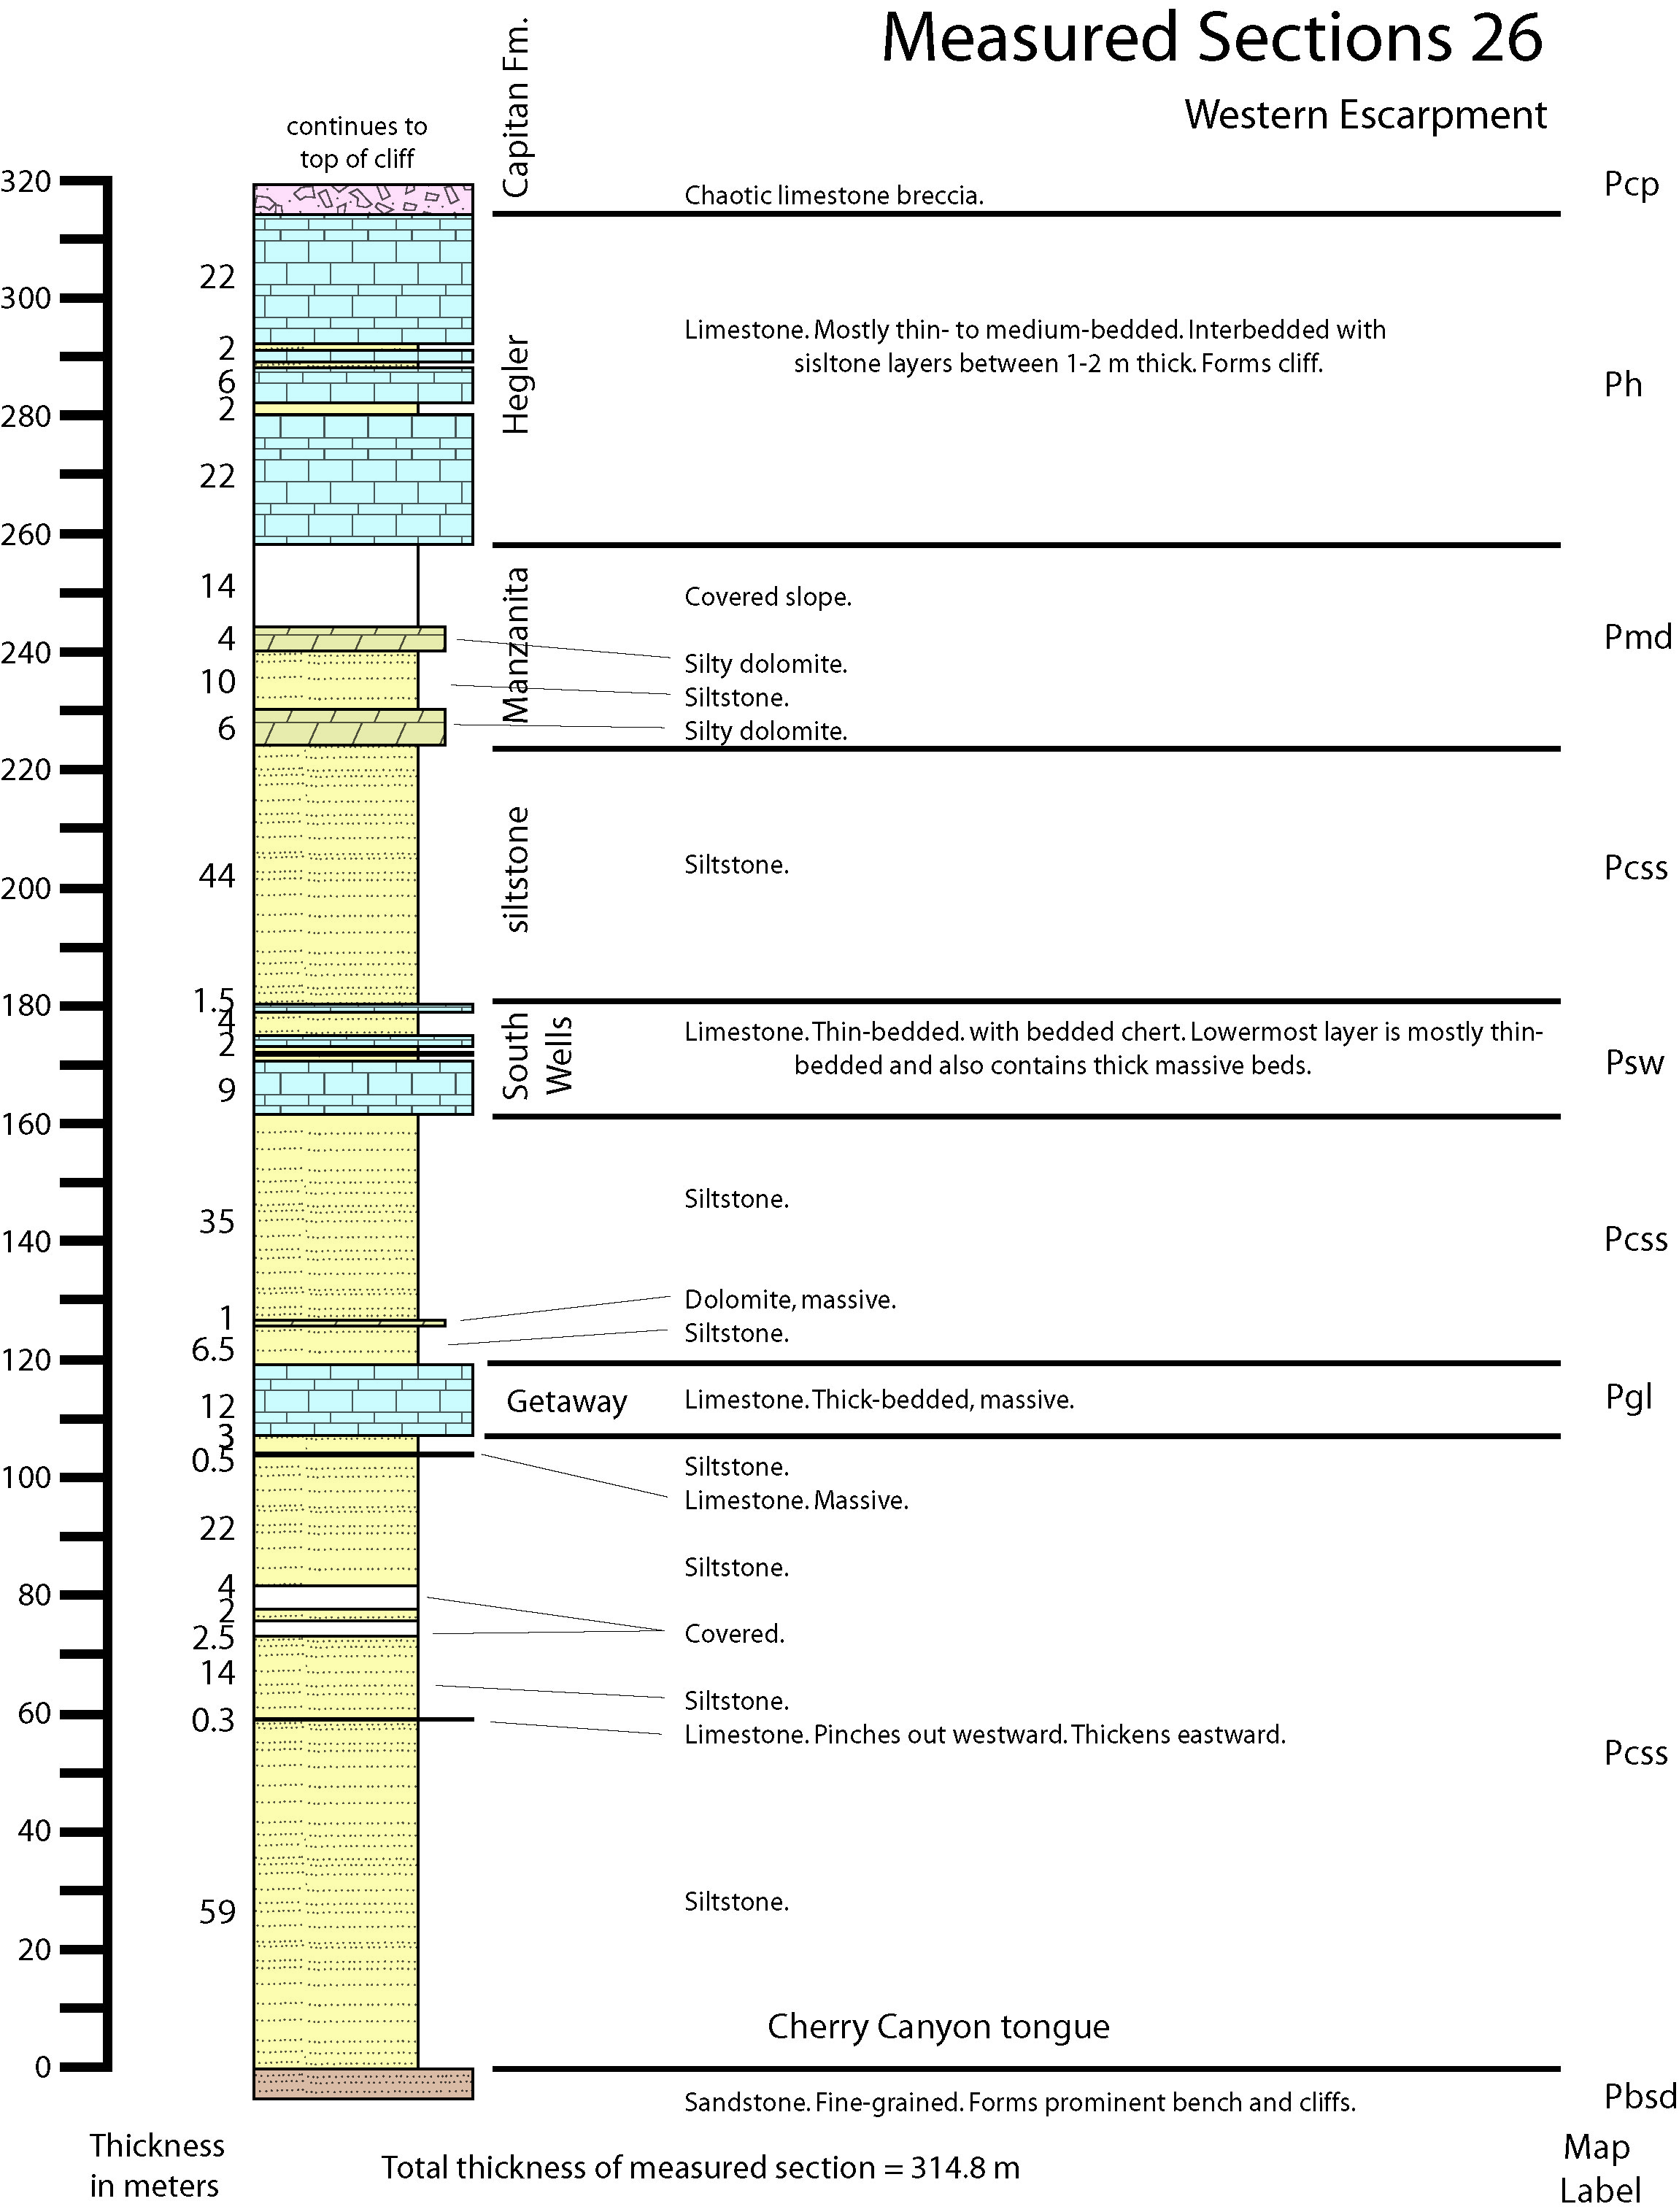
| Measured Section 26.jpg | 915 KB | 09/03/2020 11:13:26 AM |
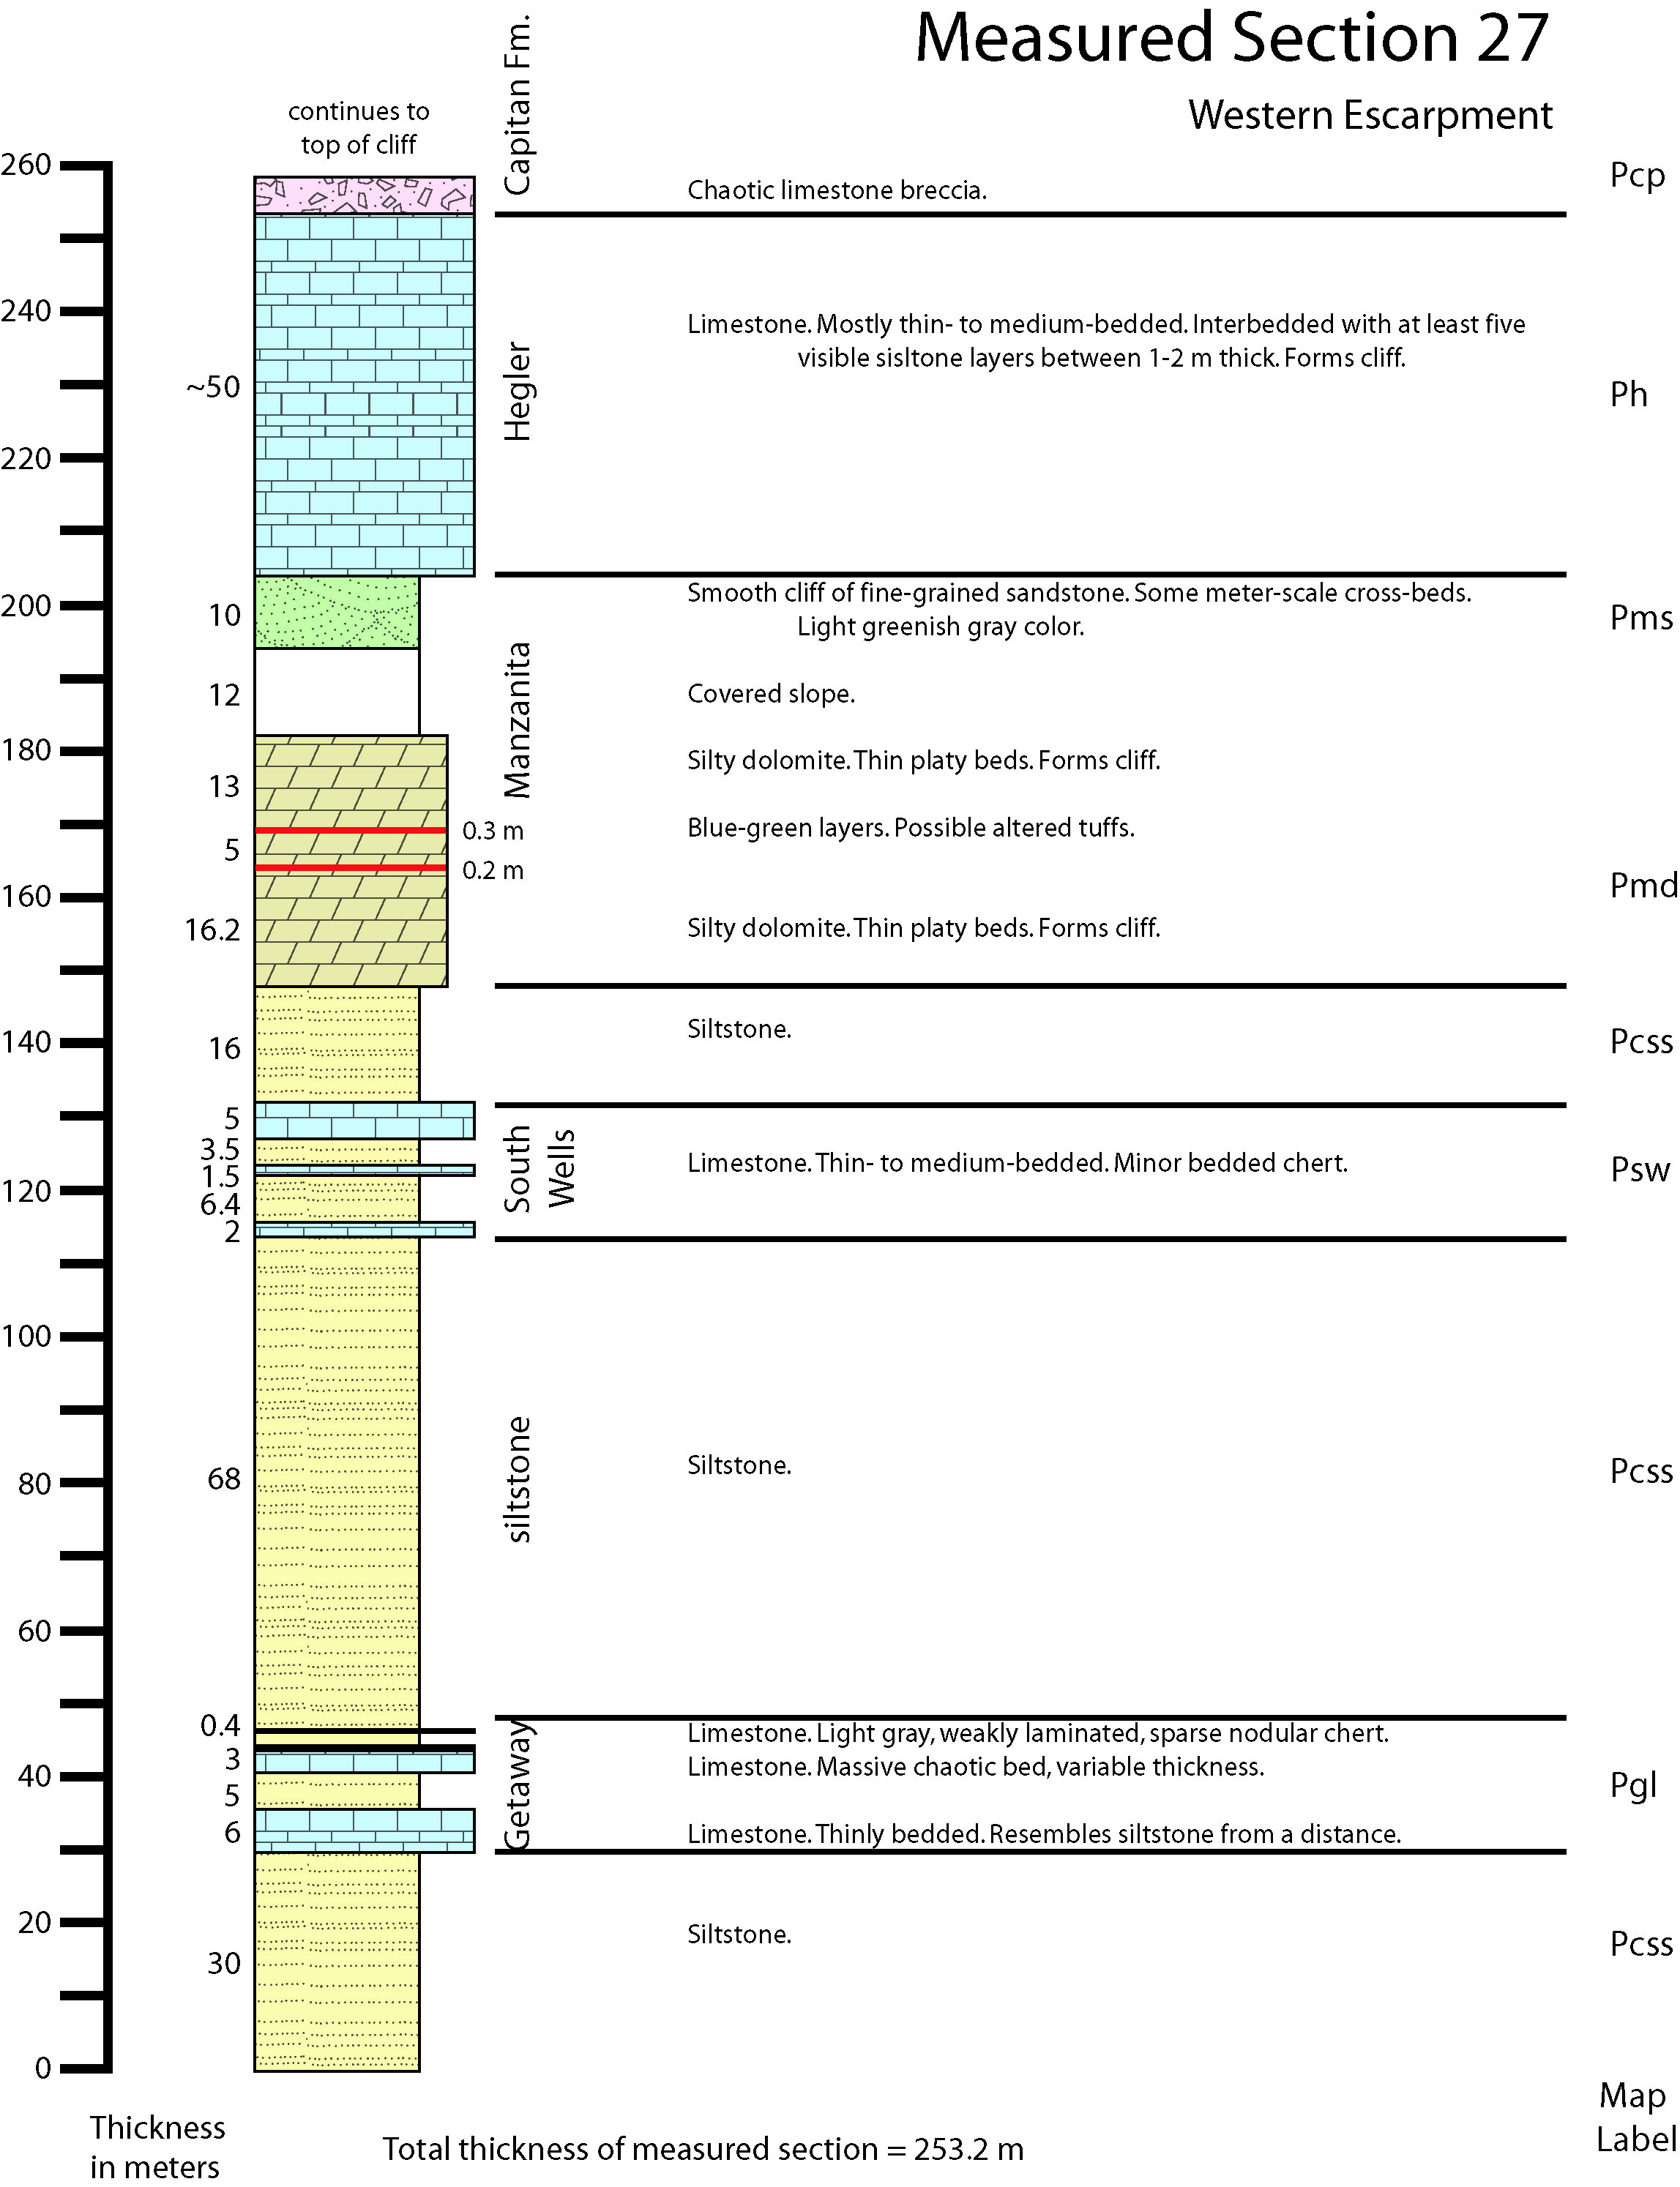
| Measured Section 27.jpg | 882 KB | 09/03/2020 11:13:26 AM |
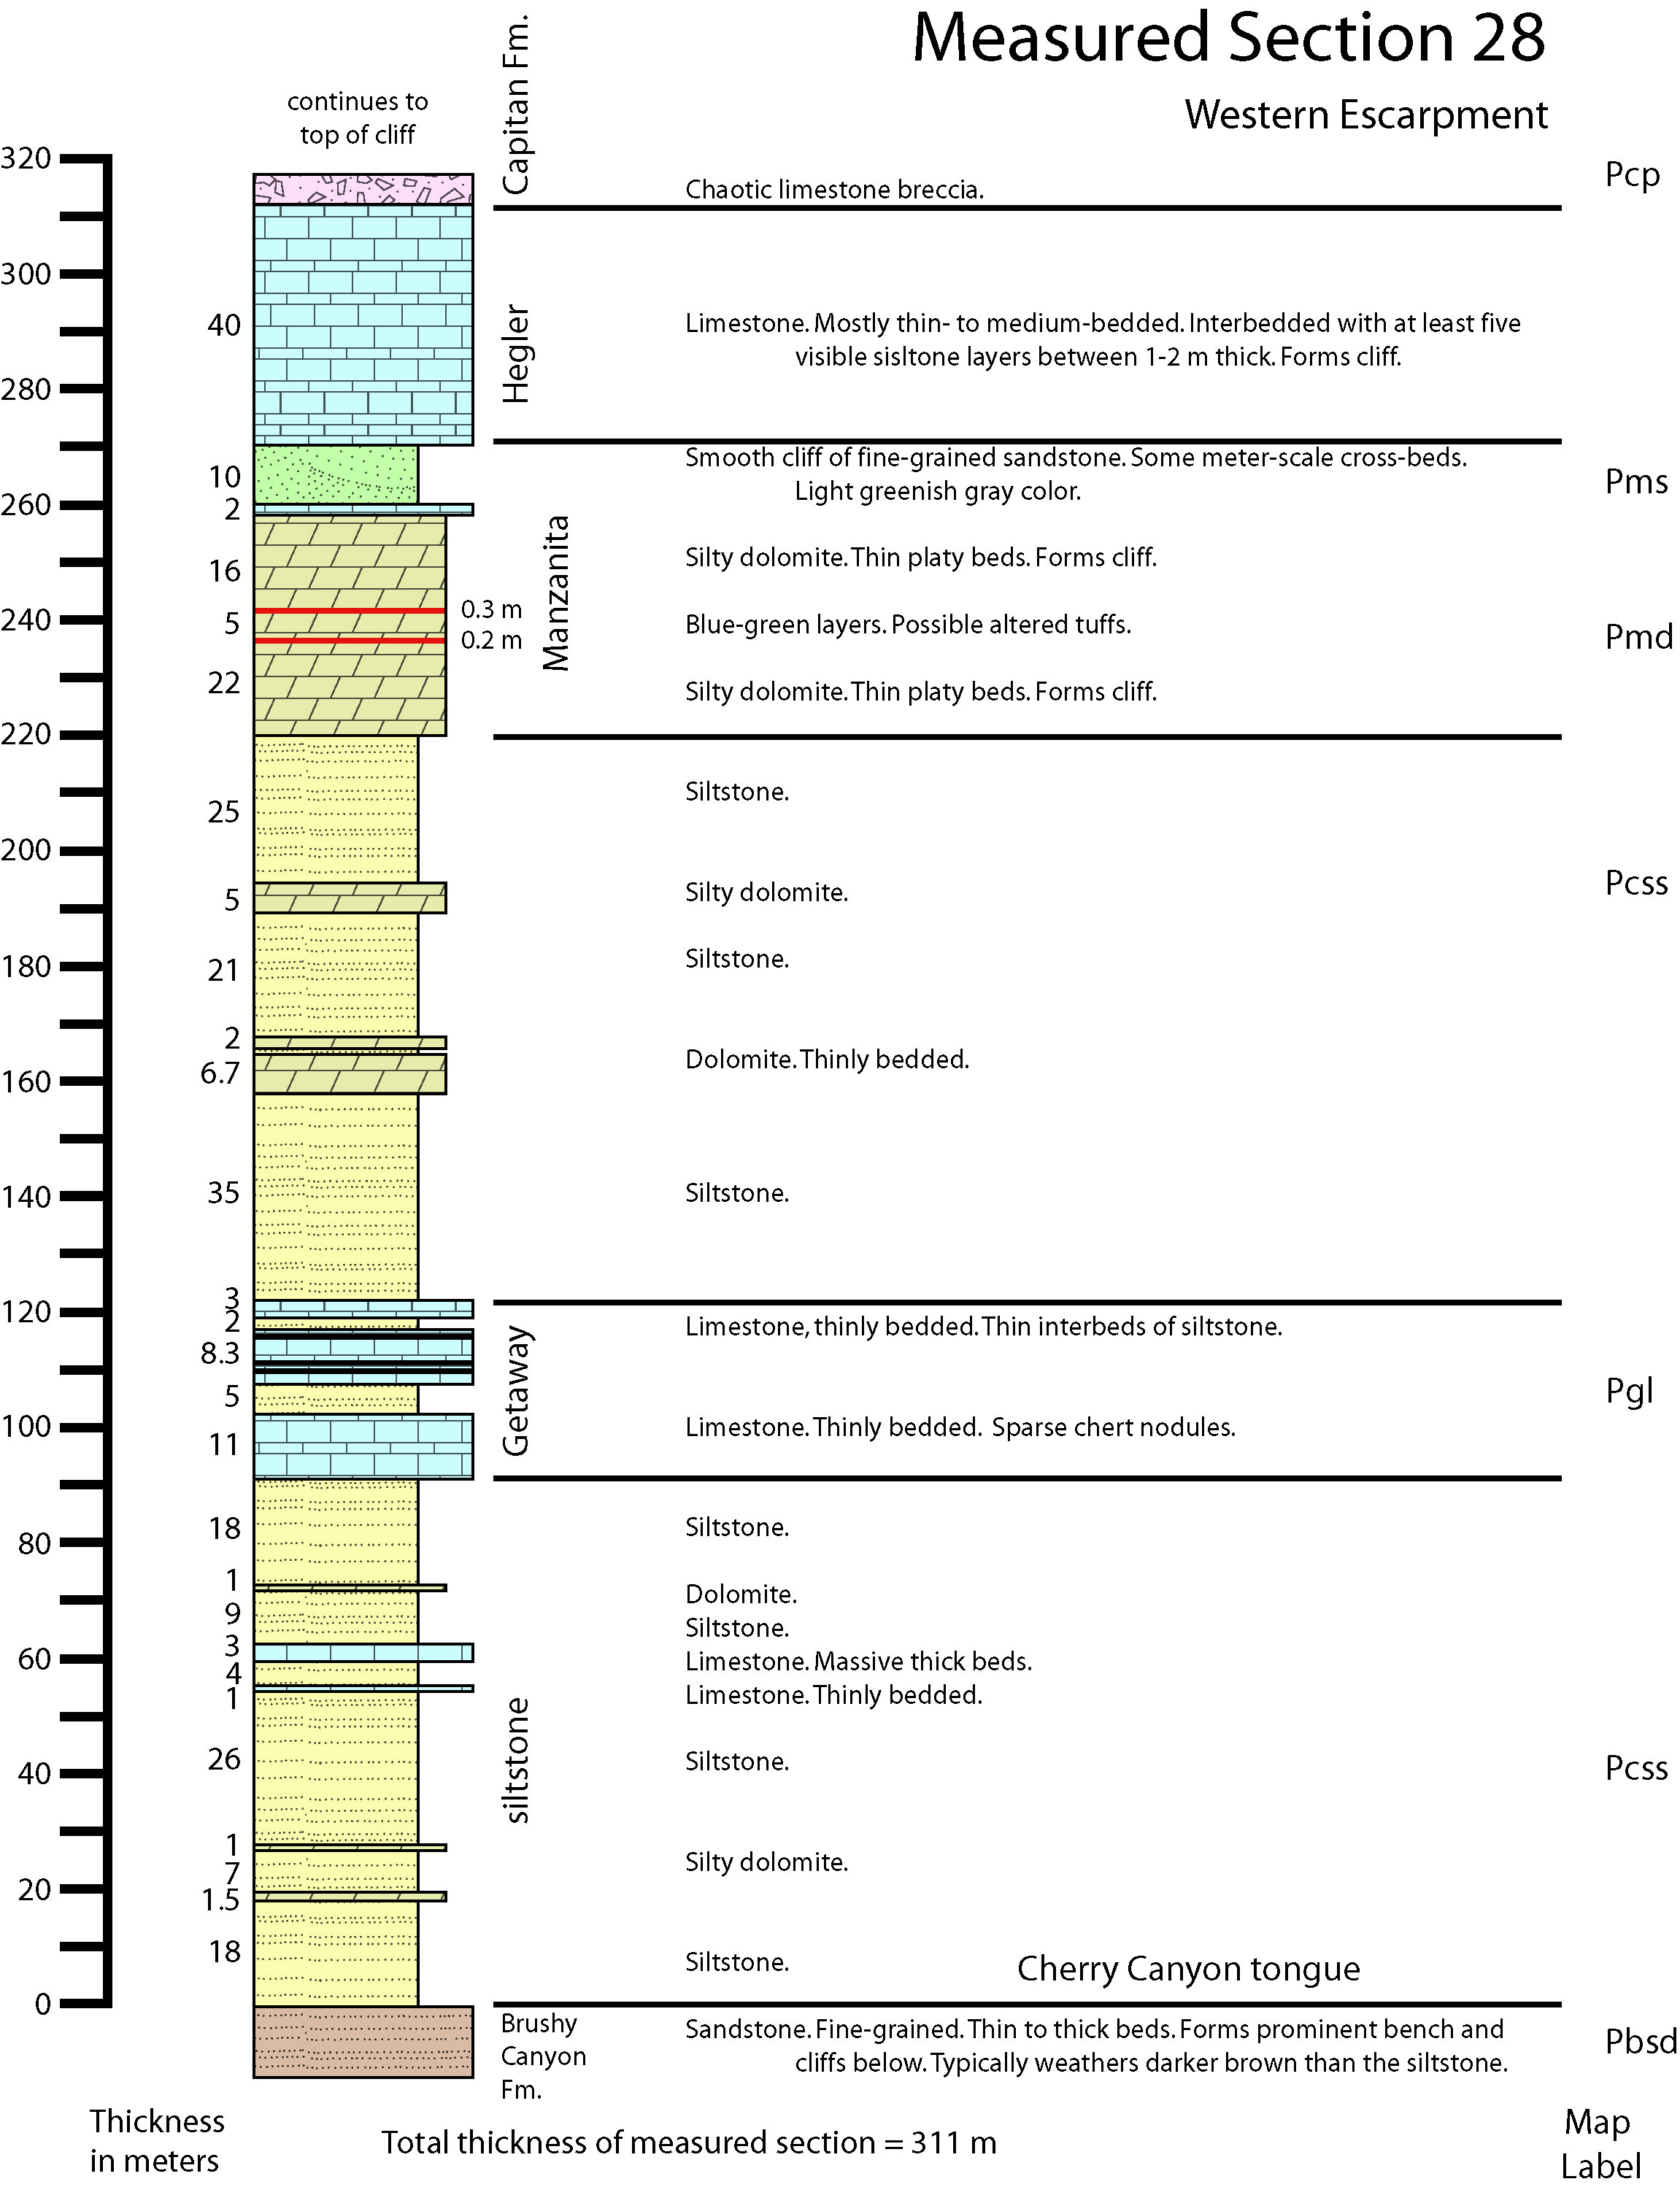
| Measured Section 28.jpg | 967 KB | 09/03/2020 11:13:28 AM |
| Measured Section 29.jpg | 1.13 MB | 09/03/2020 11:13:26 AM |
| Measured Section 3.jpg | 924 KB | 09/03/2020 11:13:28 AM |
| Measured Section 30.jpg | 800 KB | 09/03/2020 11:13:26 AM |
| Measured Section 31.jpg | 779 KB | 09/03/2020 11:13:26 AM |
| Measured Section 32.jpg | 754 KB | 09/03/2020 11:13:26 AM |
| Measured Section 33.jpg | 755 KB | 09/03/2020 11:13:28 AM |
| Measured Section 4.jpg | 688 KB | 09/03/2020 11:13:28 AM |
| Measured Section 5.jpg | 886 KB | 09/03/2020 11:13:28 AM |
| Measured Section 6.jpg | 956 KB | 09/03/2020 11:13:28 AM |
| Measured Section 7a.jpg | 1.00 MB | 09/03/2020 11:13:28 AM |
| Measured Section 7b.jpg | 750 KB | 09/03/2020 11:13:28 AM |
| Measured Section 8.jpg | 1.15 MB | 09/03/2020 11:13:28 AM |
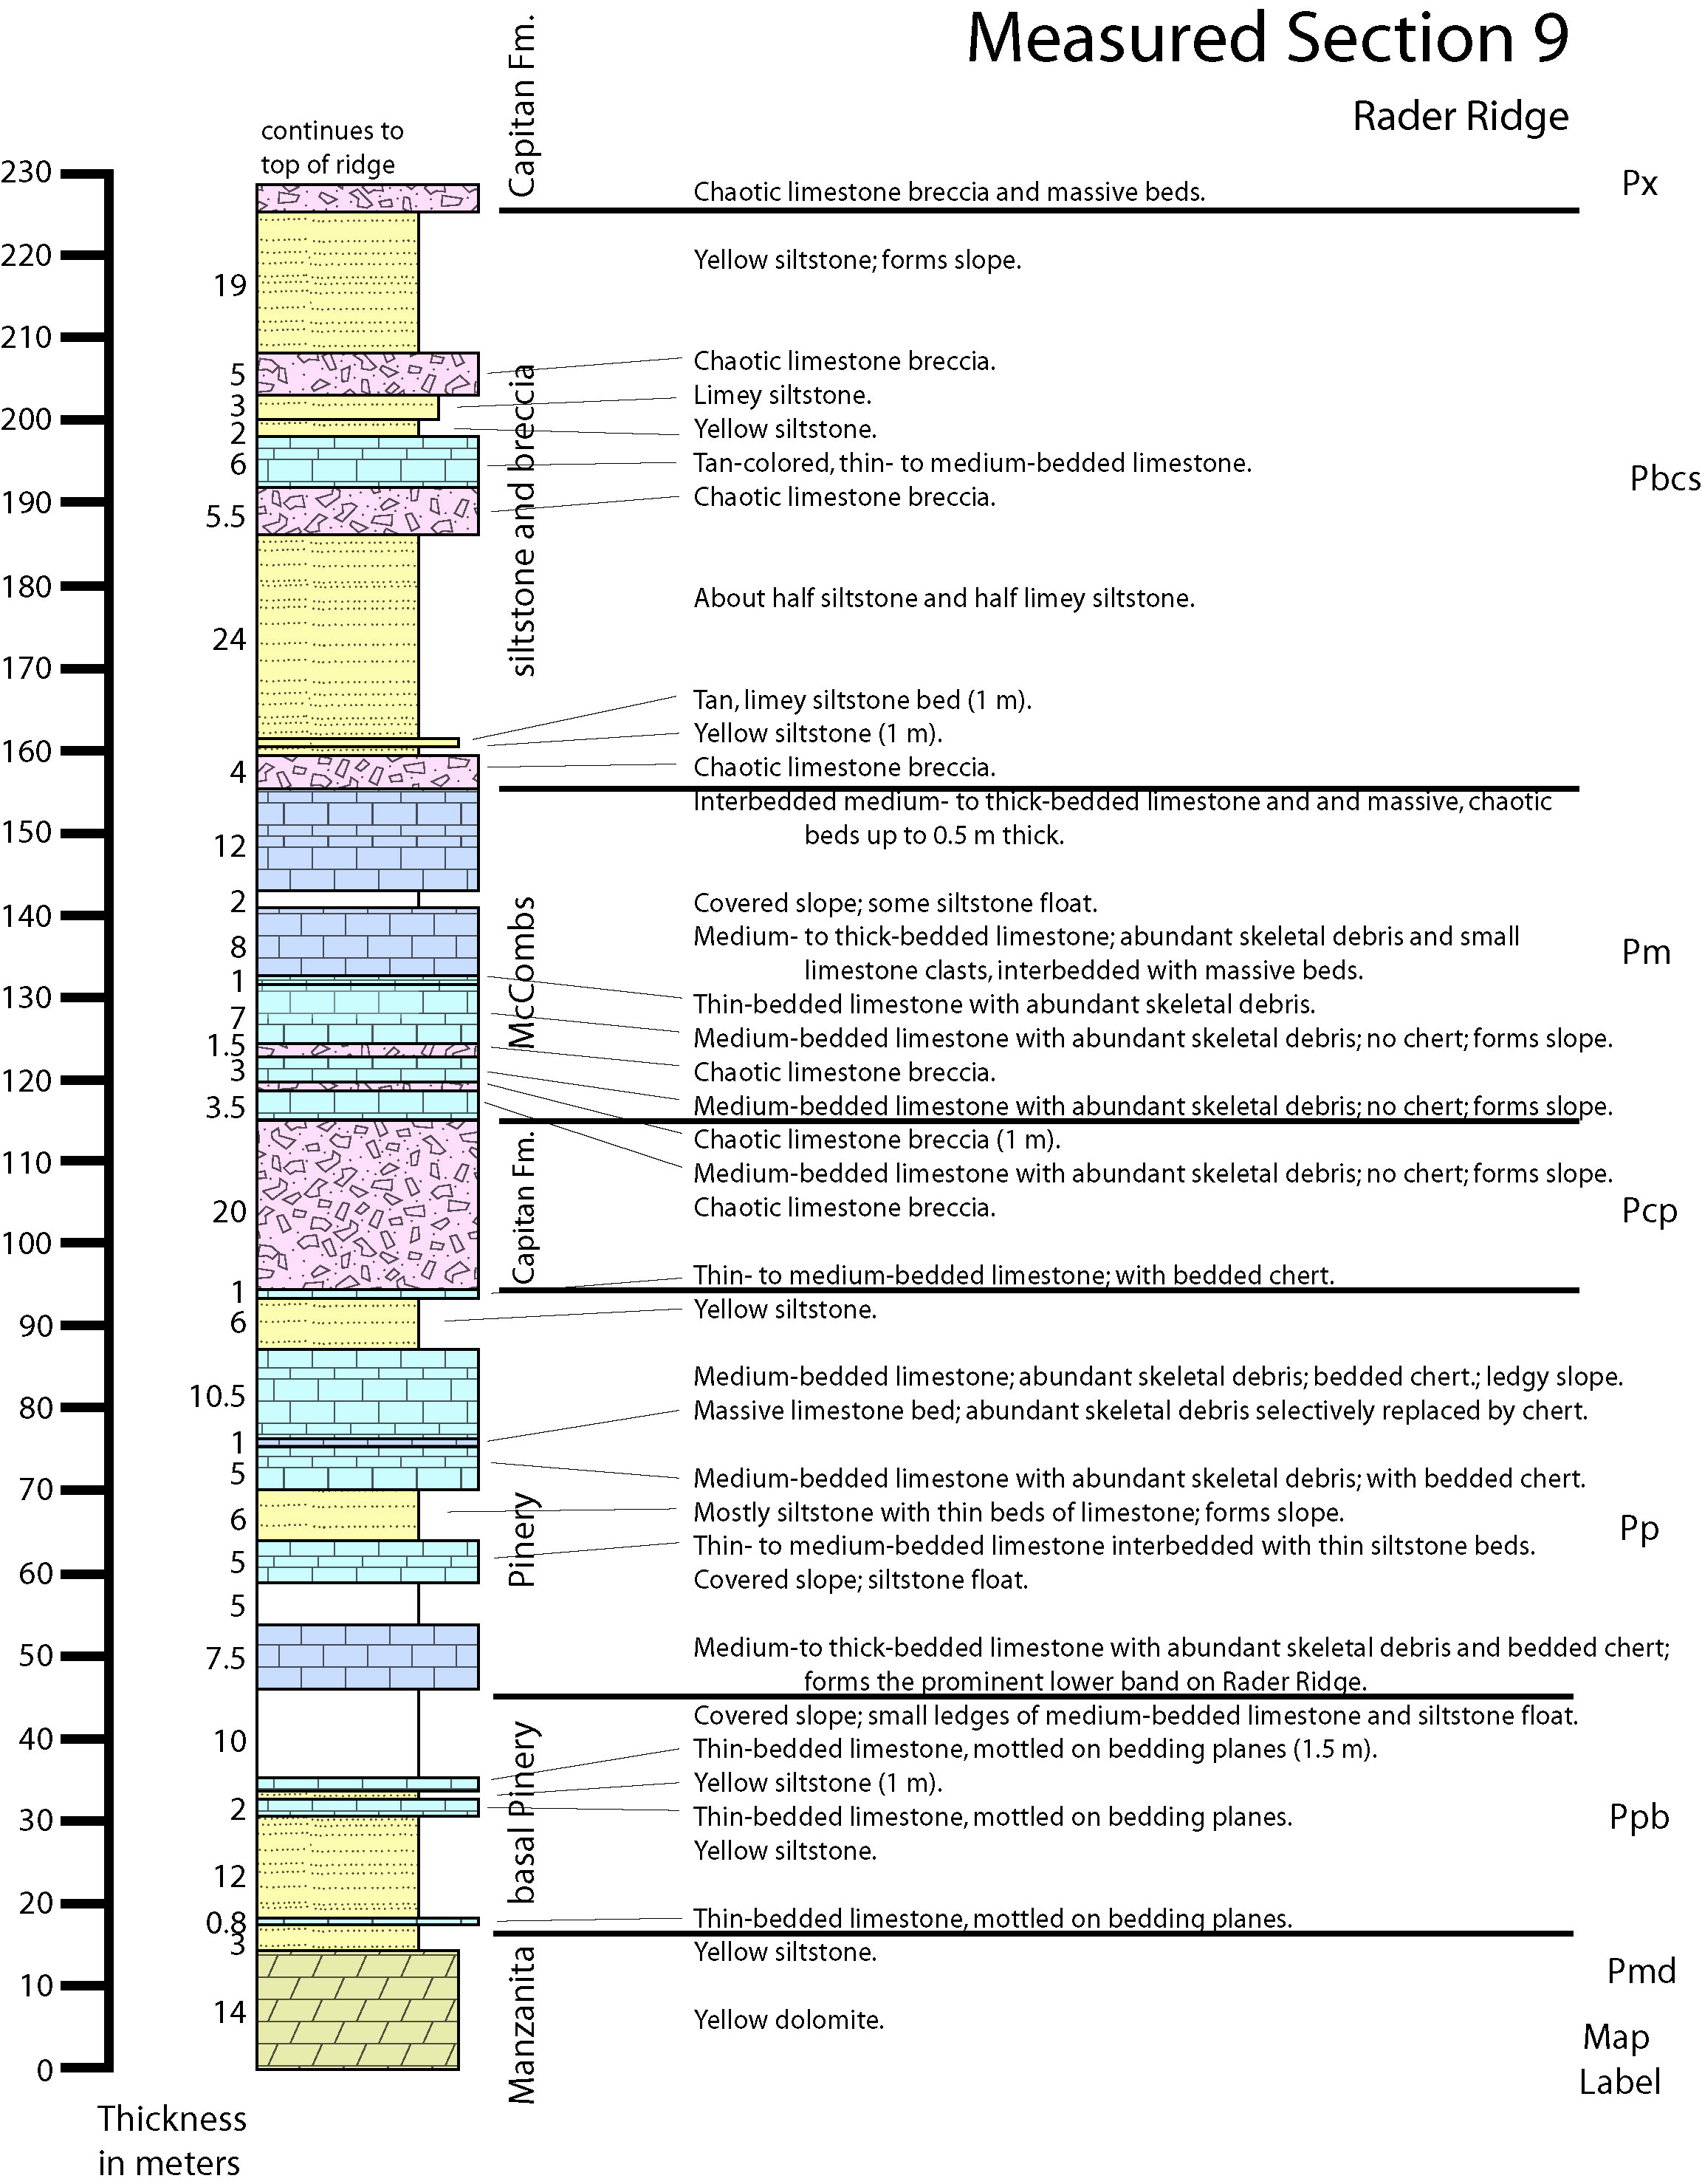
| Measured Section 9.jpg | 1.24 MB | 09/03/2020 11:13:26 AM |
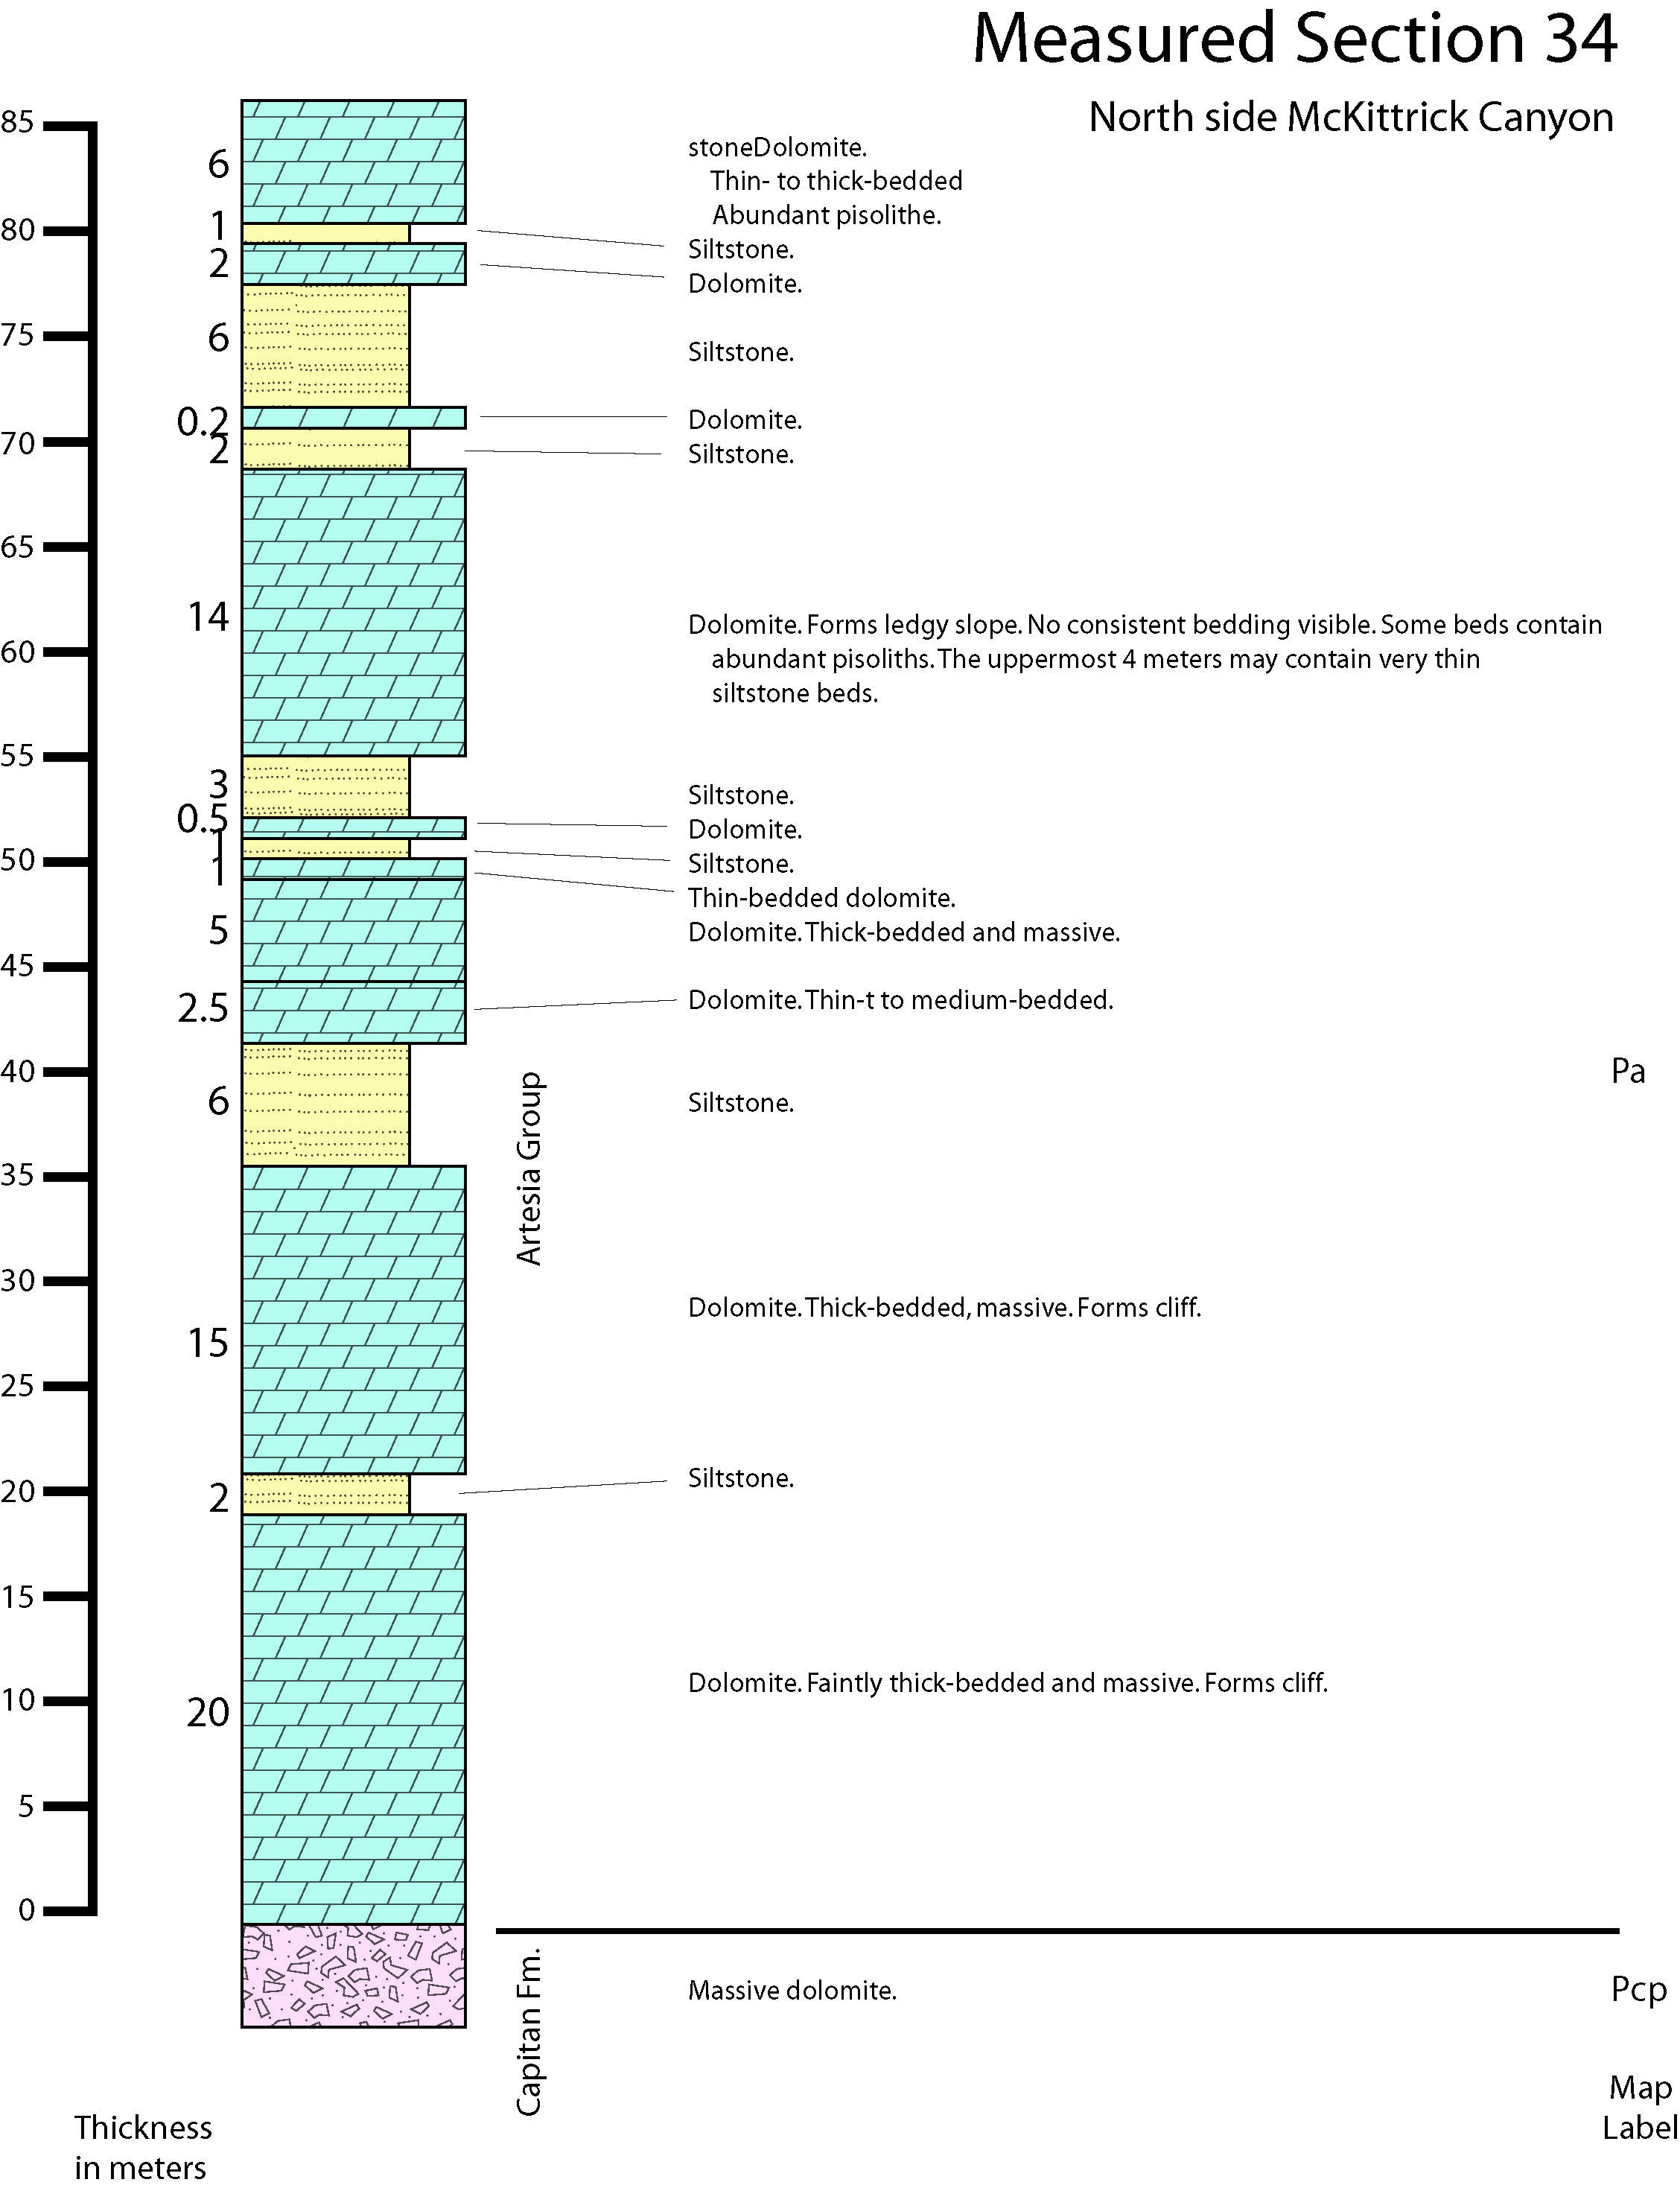
| Measured Section34.jpg | 788 KB | 09/03/2020 11:13:26 AM |
Most open-file reports are PDF files and require the free Adobe Acrobat Reader software to view. These reports may also contain GIS data or other file types, and some are collections of files that are intended to run from a CD-ROM or local hard drive.