Pychron is a comprehensive hardware control and data reduction package developed and maintained by Dr. Jake Ross. Written in Python for cross-platform use, Pychron interfaces with a variety of digital electronics via serial, Ethernet, USB interfaces.
Mass Spec
Note: The following description is for an older software setup called Mass Spec (used prior to Pychron) at NMGRL.
Mass Spec is a comprehensive hardware control and data reduction package developed and maintained by Al Deino of the Berkeley Geochronology Center. Written in RealBasic for the MacOS X operating system, Mass Spec interfaces with the digital electronics supplied by MAP via the GPIB interface (IEEE-488) to control and/or monitor all of the critical mass spectrometer components. The Mass Spec software is also interfaced (GPIB and RS-232) to most of the extraction system. The Mass Spec spectrometer and extraction system control features allow the NMGRL to run completely automated for several days at a time, with little or no human interaction.
After data is collected by the Mass Spec program, it is stored in a MySQL database accessible to all staff and students of the NMGRL. The data reduction features of the program allow unsurpassed control in handling of background, baseline, regression, discrimination, J-value and irradiation constant values, statistics and their application to a sample's 40Ar/39Ar apparent age. Manuscript-quality graphs and tables are easily generated and modified by the Mass Spec software.
Without the Mass Spec software package, the NMGRL would not be capable of producing the quality or quantity of data that it does.
Sample of the hardware that is controlled and monitored by the Mass Spec program.
Component
Interface
Control/Measurement
MAP digital electronics
GPIB
source high voltage, magnet current, electron multiplier voltage and current, faraday cup voltage
Agilent 34970A
GPIB
pneumatically operated valves, laser output, lab temperature/humidity, cooling water status, air compressor status, V-70 turbo pump status
Newport X-Y stage controller
GPIB
CO2 laser stage, UV laser stage
Porter (Rose)
RS-232 (serial)
Eurotherm furnace power, furnace loader system, UPS, extraction line vacuum status
Video capture
PCI card
video capture of CO2 laser fusion, UV laser ablation or furnace step-heating
Mass Spec screenshots (hardware control)
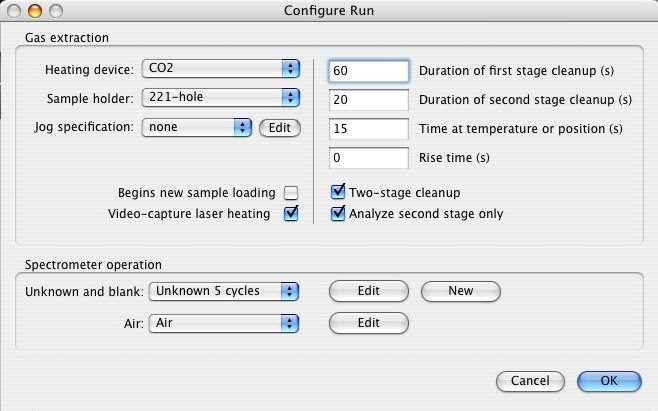
Window used to configure the Mass Spec program for laser or furnace analyses. Time at temperature/fusion and the spectrometer operation (# of cycles, counts, mass positions, baselines, etc.).
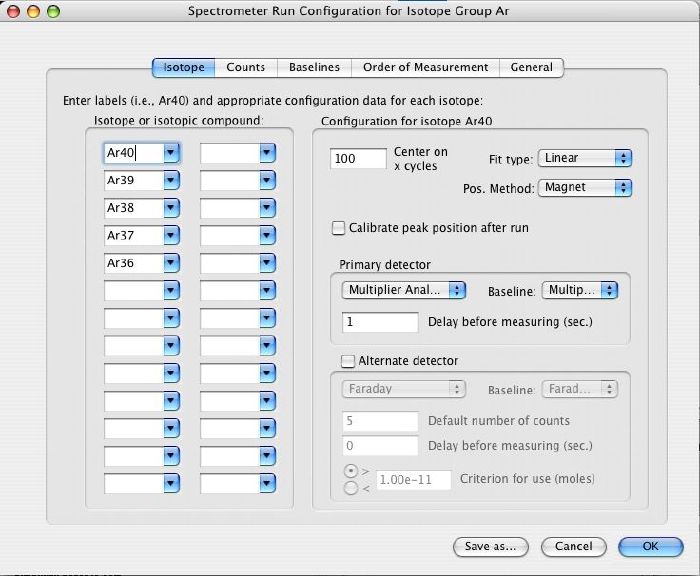
Configuration screen to specify which isotopes of argon to measure for an analyses set, how often to center on the calibration isotope (usually 40Ar), and what detector to use (electron multiplier or faraday cup). Other 'tabs' in this window allow a user to specify how long to count on each isotope and baseline, how many cycles of each isotope and which isotope of argon to use for detector intercalibrations (when multiplier and faraday are used on same analysis).
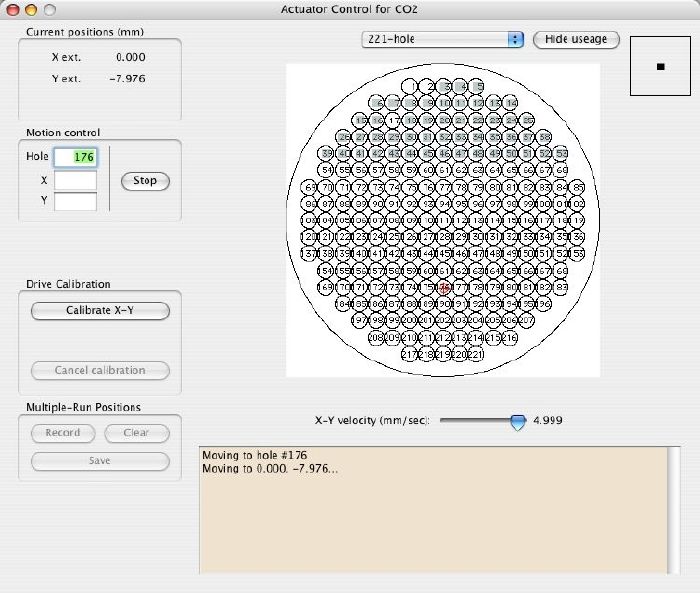
Window that is used to interface with the CO2 laser stage. The variety of sample holder planchets that NMGRL uses are accessed through this window. The Mass Spec program keeps track of which sample pits have already been fused and displays a gray dot over those holes.
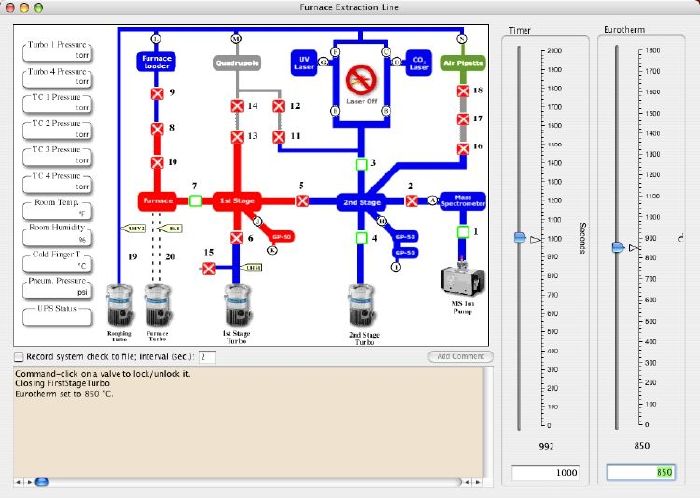
This display is used by the Mass Spec program to both show the status of valve state (open/close) and to allow the user to override computer control and actuate valves with the click of the mouse. Additional information displayed in this window is a text message of the current analysis, the time remaining of each analysis stage, the laser power or furnace temperature, vacuum pressures of the extraction system and the environmental conditions in the lab (temperature/humidity)
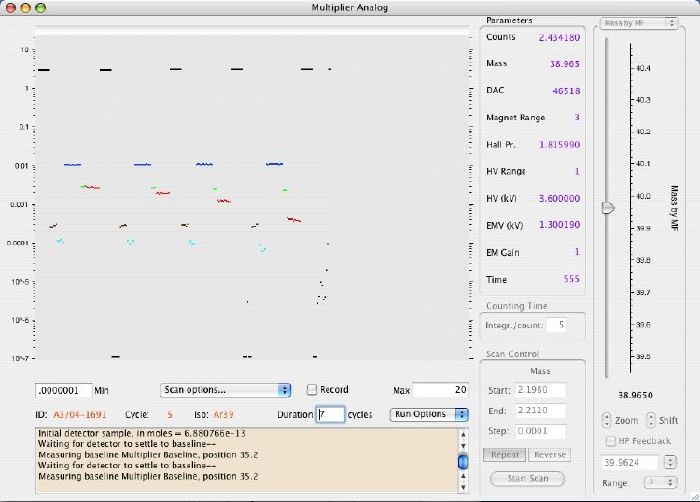
The "scan window" shows the status of the analysis of the sample gas by the mass spectrometer. Because all of the isotopes of argon are measured on only one or two collectors, each isotope (colored line segments above) is measured successively several times to determine a slope that is regressed back to "time zero" (when the gas was equilibrated with the mass spectrometer). The subsequent ratios are used to eventually calculate the age of the sample.
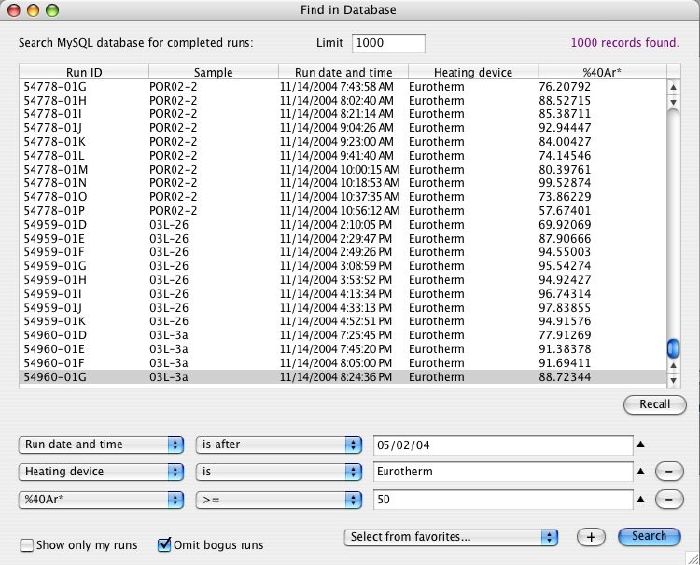
The Mass Spec program uses a MySQL database to store all collected isotopic and machine data. Because of the power of a relational database, Mass Spec can search for data and data relationships quickly and easily (e.g. room temperature during a given analyses, signal size as a function of electron multiplier voltage, mass spectrometer discrimination versus source high voltage, etc.)
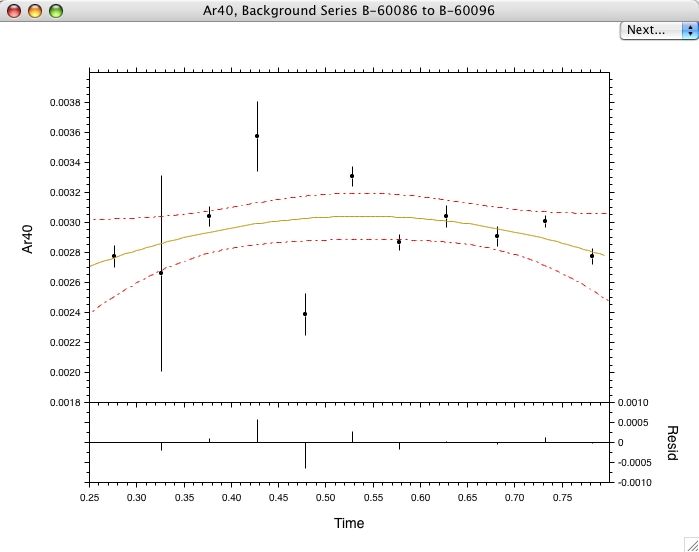
During the data reduction process, the user must be aware of the variety of factors that potentially influence the precision and accuracy of the 40Ar/39Ar apparent age. The above example illustrates the variability of extraction line and mass spectrometer background levels for the different isotopes (here 40Ar) that precede and follow analyses of sample gas. The program allows the user to look at virtually any number of background measurements, fit a curve/line/average to those values and interpolate new background values to a sample measurement.
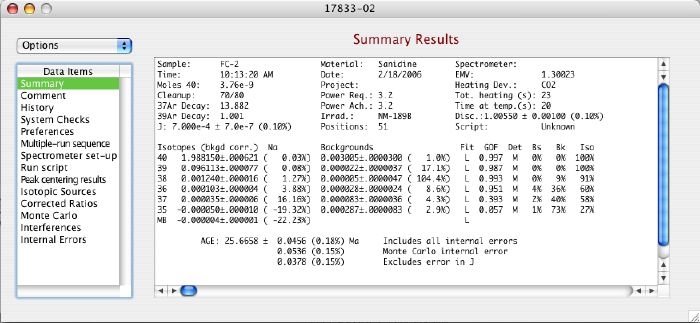
Above is a tabulated display of one single analysis (CO2 laser). A variety of information is displayed in this one window (and by additional columns at left), including background measurements applied to the sample measurments, the isotopic regression fit type, and of course age. The MySQL database also stores other information pertinent to this analysis (history of data reduction methods applied to the analysis, the spectrometer preferences used to collect the data, the scripts that were used to extract the argon, etc.).
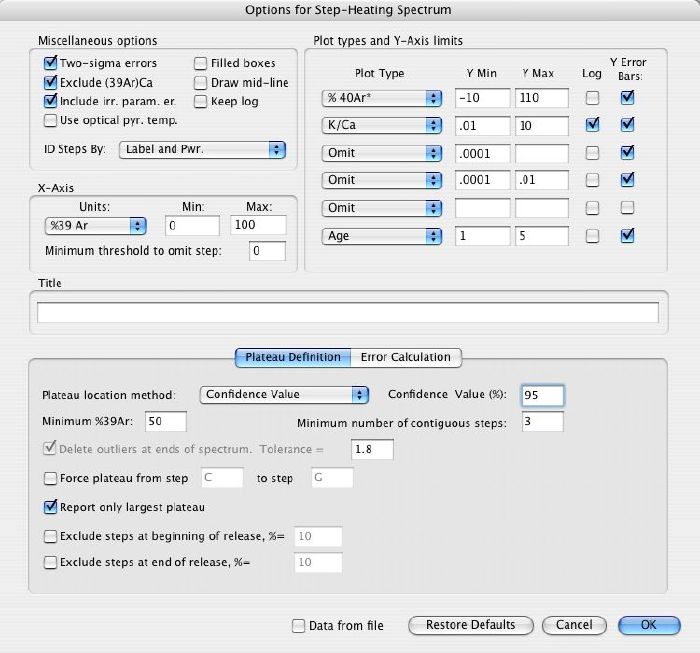
Throughout the data collection and data reduction process, it is nice to be able to display the resulting age information in a graphical format. The Mass Spec program will readily recall data saved in the MySQL database and plot it in an age spectrum, isochron (inverse or normal) or probability distribution (ideogram) diagram. Each plot can be configured according to the user's preference (e.g. supplemental plots, error statistics, aesthetics).