
New Mexico Geochronology Research Laboratory
40Ar/39Ar Data
Here we explain the most common formats used to represent argon data. Some graphical representations include age spectra, isochrons and inverse isochrons, and ideograms or probability distribution diagrams. Data is also represented numerically, in a table format.
Age Spectrum
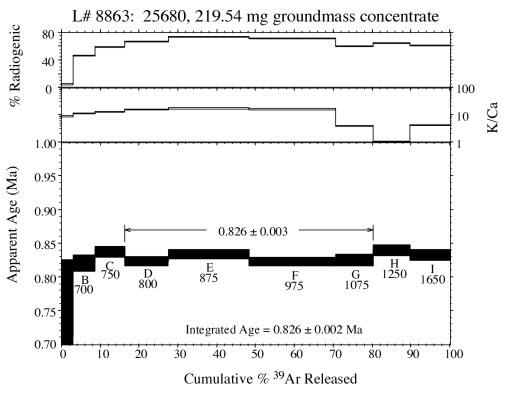
Properties of an age spectrum:
- The x-axis is the cumulative percent 39ArK released from the sample over the course of the entire step-heating analysis (e.g. step F was heated to 975 degrees celcius and released approximately 20% (from 50-70%) of the total 39Ar).
- The y-axis on the lower plot is the apparent age in millions of years (Ma) in ascending order from 700 thousand years ago (0.70 Ma) to one million years ago (1.00 Ma).
- The individual boxes on the lower plot are the age plus/minus error for each of the heating steps. For example, step B (700 degrees) has a calculated apparent age of approximately 0.820 plus/minus 0.005 Ma. The age is corrected for extraction line and mass spectrometer contributed blank, nucleogenic isotopes and atmospheric contamination (assuming a trapped 40Ar/36Ar value of 295.5). The error box associated with the ages may be plotted as 1 or 2 sigma, depending on the preference of the user.
- The margin including steps D through G is called a plateau. It has been commonly defined by the strict criteria of Fleck et al (1977): 3 or more contiguous heating steps comprising 50% or more of the 39ArK released and overlapping at the two sigma confidence level. Steps D through G define a plateau meeting these criteria. Steps C and H do not because, while overlapping the immediately adjacient heating steps, they do not overlap step F. The NMGRL no longer relies on the plateau definition of Fleck et al (1977), but rather tests the statistical precision of a number of contiguous heating steps using the criteria of Mahon (1996). The plateau age is calculated by weighting each step by the inverse of the variance. The plateau error is calculated using the method of Taylor (1982).
- The age immediately above the x-axis is the total gas or integrated age. This is analagous to a laser-fusion age or conventional K/Ar age and therefore is not used frequently. The integrated age is calculated by weighting the individual steps by the fraction of 39Ar released.
- The box immediately above the age information graph is for plotting the K/Ca ratio of each individual heating step. Commonly plotted as log values, these ratios help to indicate what mineral phases may be degassing at certain temperatures. For instance, the K/Ca ratio for the above sample remains relatively constant at about 15-20 for the initial 975 degrees of heating. But then at 1075 and greater the K/Ca ratio drops, at one point to about 1, indicating a phase with either a relatively larger calcium content or relatively smaller potassium content. In the case of basalts, this lower K/Ca may arise from amphiboles or pyroxenes. K/Cl ratios may also be plotted in this auxilliary box. Changing K/Cl ratios may help determine when fluid inclusions are degassing from a plutonic potassium feldspar.
- The auxilliary plot on the top of the age spectrum graphically represents the radiogenic 40Ar (40Ar*) yield from the individual heating steps. In the case of the above sample, the first two heating steps have radiogenic yields below 50% (ie. 50% of the 40Ar is radiogenic while the remainder is atmospheric and/or nucleogenic). The radiogenic yields for the remaining heating steps is significantly greater than 50%. Ideally, we would like to see radiogenic yields approaching 100%. However, effects such as alteration often contaminate the sample with large quantities of atmospheric 40Ar overwhelming the radiogenic 40Ar. This problem can be particularily troublesome for very young samples that already have very little 40Ar*.
Inverse Isochron
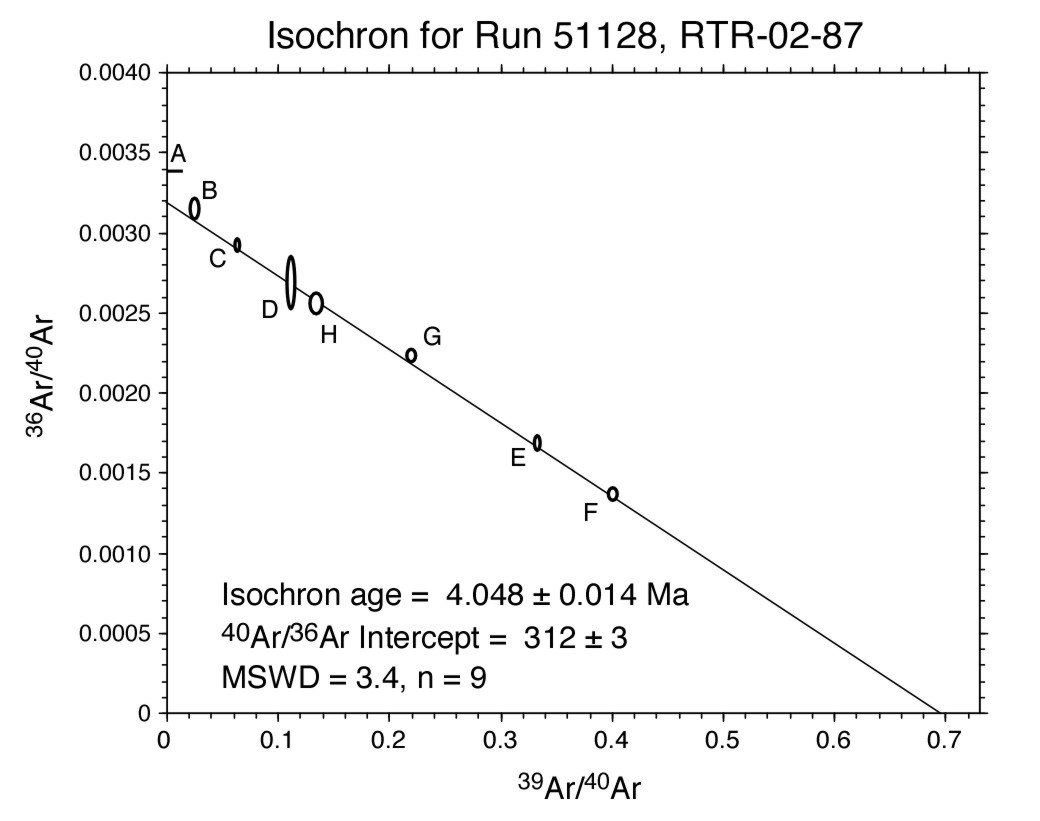
Properties of an inverse isochron:
- Argon data can be plotted on an isochron to help assess the isotopic composition of Ar trapped at the time of argon closure, thereby testing the assumption that trapped argon isotopes have the composition of modern atmosphere which is implicit in age spectra.
- The x-axis plots the 39Ar/40Ar ratio of the individual heating steps. Ratios are corrected for extraction line and mass spectrometer blank contributions and nucleogenic isotopes. Correction for atmospheric argon is not applied.
- The y-axis plots the 36Ar/40Ar ratio of the individual heating steps. Ratios are corrected for extraction line and mass spectrometer blank contributions and nucleogenic isotopes. Correction for atmospheric argon is not applied.
- The "best fit" line through the data array yields the trapped 40Ar/36Ar value from the y-intercept and the 40Ar/39Ar value (age) from the x-intercept.
- The MSWD or Mean Sum Weighted Deviates is a statistical "goodness-of-fit" indicator where the higher the MSWD value, the poorer the line fits the data. Commonly accepted MSWD values are less than 2.5. The error on the x- and y-intercepts is calculated from the regression results of York (1969)
- Isochrons are most useful for step-heated or total fusion data which have a significant spread in radiogenic yield: highly radiogenic data points plot near the x-axis while low radiogenic data points plot near the y-axis. The spread of data points along the 'chron line' help better constrain the intercepts, thus reducing uncertainties.
- For the above isochron analysis, a step-heated groundmass concentrate yielded a very poor age spectrum with a spread in ages from 4.5 to 6.0 Ma (no plateau). The isochron indicates that the sample contained an elevated trapped 40Ar/36Ar ratio (312 ± 3 instead of 295.5). The excess of 40Ar is corrected for in the isochron yielding an age of 4.05 ± 0.01 Ma (compared to approximately 5.2 Ma for the age spectrum).
Age probability distribution diagram (a.k.a. ideogram)
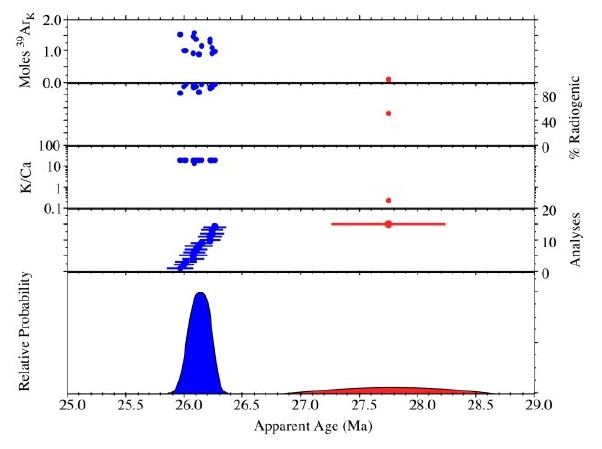
Properties of an inverse isochron:
- In the lower plot, apparent age (x-axis) is plotted versus the summation of the normal distribution of each individual analyses (Deino and Potts, 1992). This is roughly comparable to a histogram plot.
- Auxilliary plots can include: moles of 39ArK released per crystal, radiogenic yield, K/Ca ratio, Cl/K ratio (not pictured), as well as the age±error for the individual data points.
- The probability distribution diagram is most useful for displaying single-crystal laser-fusion data to assess the distribution of the population. Individual analyses which fall outside a distinct population are easily identified. These outlyers can included xenocrysts, seperate mineral phases, altered grains and/or laboratory contaminants. In the above plot, a number of sanidine grains define a population at approximately 26.1 Ma (blue). An anomalously old grain at ~27.8 Ma (red) can easily be identified as plagioclase due to it's comparitively low K/Ca ratio and 39ArK yield.
Data Tables
1 |
2 |
3 |
4 |
5 |
6 |
7 |
8 |
9 |
10 |
11 |
|---|---|---|---|---|---|---|---|---|---|---|
| ID | Temp | 40Ar/39Ar | 37Ar/39Ar | 36Ar/39Ar | 39ArK | K/Ca | 40Ar* | 39Ar | Age | ±1s |
| (°C) | (x 10-3) | (x 10-15 mol) | (%) | (%) | (Ma) | (Ma) | ||||
| Sample ABC123, 10.15 mg biotite, J=0.004321, Lab#=4567-89 | ||||||||||
| A | 700 | 28.44 | 0.0666 | 79.51 | 0.581 | 7.7 | 17.3 | 0.6 | 29 | 12 |
| B | 800 | 14.38 | 0.0127 | 13.61 | 4.52 | 40.2 | 71.8 | 5.5 | 59.45 | 0.85 |
| C | 920 | 11.64 | 0.0052 | 2.001 | 13.7 | 98.9 | 94.7 | 20.3 | 63.37 | 0.27 |
| D | 1000 | 11.46 | 0.0045 | 1.517 | 10.1 | 114.5 | 95.9 | 31.2 | 63.14 | 0.32 |
| E | 1075 | 11.62 | 0.0102 | 2.217 | 8.47 | 49.8 | 94.1 | 40.3 | 62.87 | 0.39 |
| F | 1110 | 11.45 | 0.0137 | 1.719 | 5.57 | 37.1 | 95.3 | 46.3 | 62.73 | 0.56 |
| G | 1180 | 11.47 | 0.0413 | 1.363 | 13.3 | 12.3 | 96.3 | 60.6 | 63.45 | 0.26 |
| H | 1210 | 11.27 | 0.0547 | 0.6794 | 19.3 | 9.3 | 98.0 | 81.4 | 63.46 | 0.20 |
| I | 1250 | 11.24 | 0.0457 | 0.4782 | 16.5 | 11.2 | 98.5 | 99.3 | 63.64 | 0.21 |
| J | 1300 | 11.57 | 0.0231 | 2.289 | 0.665 | 22.1 | 93.9 | 100.0 | 62.5 | 4.3 |
| total gas age | n=10 | 92.8 | 41.8 | 62.92 | 0.41 | |||||
| plateau | MSWD=0.8 | n=8 | steps C-J | 87.7 | 42.1 | 94.5 | 63.39 | 0.20* | ||
| Notes: | ||||||||||
| Isotopic ratios corrected for blank, radioactive decay, and mass discrimination, not corrected for interferring reactions. | ||||||||||
| Individual analyses show analytical error only; plateau and total gas age errors include error in J and irradiation parameters. | ||||||||||
| Analyses in italics are excluded from final age calculations. | ||||||||||
| n= number of heating steps | ||||||||||
| K/Ca = molar ratio calculated from reactor produced 39ArK and 37ArCa. | ||||||||||
| * 2s error | ||||||||||
| ** MSWD outside of 95% confidence interval | ||||||||||
- The first column in the data table is the analysis identification (ID). The letter is assigned to each progressively hotter temperature step as a sample is heated in the furnace. This post-script is appended to the unique laboratory number assigned to each sample. In this example, the laboratory number (Lab#) is 4567-89, so the first heating step would read 4567-89A (700°C).
- Column 2 is the set-point temperature (in degrees centrigrade) of the furnace for each heating step. Typically, we start degassing samples at about 500-700 degrees and increase the temperature approximately 100°C per heating step. The "heating schedule" varies depending upon what type of material is being analyzed and how much information we are trying to obtain.
- Column 3 is the 40Ar/39Ar ratio of each single analysis (heating step). This ratio is the primary ratio for determining the age of a sample. This ratio is corrected for extraction line and mass spectrometer blank, any radioactive decay that may have occurred since the neutron irradiation and mass discrimination of the mass spectrometer. It is not corrected for interference isotopes produced during irradiation.
- Column 4 is the 37Ar/39Ar ratio of each single analysis (heating step). This ratio is useful for correcting against nuclear interference reactions (specifically 39ArK produced from calcium) and determining the Ca/K ratio of an analysis. This ratio is corrected for extraction line and mass spectrometer blank, any radioactive decay that may have occurred since irradiation and mass discrimination of the mass spectrometer. It is not corrected for interference isotopes produced during irradiation.
- Column 5 is the 36Ar/39Ar ratio of each single analysis (heating step). This ratio is necessary for determining the radiogenic yield of each analysis (based on the amount of 39ArK and the 40Ar/39Ar ratio). This ratio is corrected for extraction line and mass spectrometer blank, any radioactive decay that may have occurred since irradiation and mass discrimination of the mass spectrometer. It is not corrected for interference isotopes produced during irradiation.
- Column 6 is the amount of 39ArK (moles) released for each single analysis (heating step). This value is necessary for determing the number of moles of 40Ar (radiogenic and atmospheric), 37Ar (total) and 36Ar (atmospheric) of each analysis. Total 39ArK (moles) is also given for the entire sample (total gas age row) and any defined plateau (plateau row). This value is corrected for extraction line and mass spectrometer blank as well as radioactive decay, mass discrimination and interference reactions.
- Column 7 is the K/Ca ratio for each single analysis (heating step). This value is calculated from the corrected ratio 39ArK/37ArCa. This ratio is useful for determining what mineral phases may be degassing at certain temperatures. Cl/K ratios are also occasionally listed on data tables. The Cl/K ratio is calculated from the 38ArCl/39ArK ratio and is also useful for determining what mineral phases may be degassing at certain temperatures.
- Column 8 is the radiogenic 40Ar (40Ar*) yield for each single analysis (heating step). This is determined by subtracting the atmospheric 40Ar component from the total 40Ar measured by the mass spectrometer (correcting for blank, mass discrimination and interference reactions).
- Column 9 is the percent 39ArK(39Ar %) released for each single analysis (heating step). This number is calculated dividing the 39Ar value from a given analysis (heating step) by the total 39Ar released for the whole sample and summing the result with all of the previous single analyses (heating steps). This provides a "running total" of the 39Ar released from a given sample. This is the same value that is plotted on the x-axis of an age spectrum. This column is useful for determining the temperature(s) of predominant argon release.
- Column 10 is the Age of each single analysis (heating step). This number is calculated from the 40Ar/39Ar age equation (see Methodology for details).
- Column 11 is the Error (±1s Ma) of each single analysis (heating step). This is the one-sigma error calculated for each analysis from analytical uncertainties only. This value does not include the uncertainty in J-value or nuclear interference reactions.
Additional information:
total gas age - this row provides the mean age of all of the individual analyses (heating steps). Total gas ages and errors calculated by weighting individual steps by the fraction of 39Ar released. This age/error is analogous to a conventional K/Ar age determination. Other information in this row include the number of steps included in the weighted mean (n=10), the total moles of 39ArK contained within the sample and the mean K/Ca ratio for the sample.
plateau - this row provides the mean age of those individual analyses specified by the geochronologist. Plateau weighted mean ages are calculated by weighting each age analysis by the inverse of the variance. Weighted mean error calculated using the method of (Taylor, 1982). Plateau must comprise at least two contiguous steps. Beyond this requirement, different 40Ar/39Ar laboratories have different criteria for defining plateau segments. Other information in this row include the MSWD (calculated for n-1 degrees of freedom using method of Mahon, 1996), the number of steps included in the plateau age, the steps (ID) included in the plateau age, the moles of 39ArK contained within the plateau, the mean K/Ca ratio for the plateau and the cumulative percent 39ArK released for the plateau.
Notes: - these rows include any additional information the geochronologist would like to provide about the dated sample (eg. isotopic ratio correction factors, calculation methods for errors, mass spectrometer settings, etc.).
References
- Deino, A., and Potts, R., 1992. Age-probability spectra from examination of single-crystal 40Ar/39Ar dating results: Examples from Olorgesailie, Southern Kenya Rift, Quat. International, 13/14, 47-53.Fleck, R.J., Sutter, J.F., and Elliot, D.H., 1977. Interpretation of discordant 40Ar/39Ar age-spectra of Mesozoic tholeiites from Antarctica, Geochim. Cosmochim. Acta, 41, 15-32.
- Mahon, K.I., 1996. The New "York" regression: Application of an improved statistical method to geochemistry, International Geology Review, 38, 293-303.
- Taylor, J.R., 1982. An Introduction to Error Analysis: The Study of Uncertainties in Physical Measurements, Univ. Sci. Books, Mill Valley, Calif., 270 p.
- York, D., 1969. Least squares fitting of a straight line with correlated errors, Earth and Planet. Sci. Lett., 5, 320-324.