A popcorn model for radioisotopic dating
Contents
Learning activity

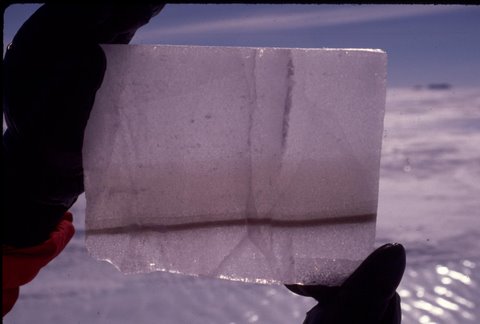
Geologists take advantage of decay of natural radioactive elements to determine the age of rocks, which can help us understand earth history. One example of this dating method is using volcanic ash layers to help determine the age of ash-bearing horizons in ice cores. Ice cores provide important records of past climate conditions because the chemical composition of the ice reveals past temperature, and tiny bubbles of air trapped between ice crystals can reveal past atmospheric composition. The volcanic ash can be dated using a technique called Potassium-Argon (K-Ar) geochronology.
K-Ar geochronology relies on the principal that radioactive elements decay over time, with a parent isotope of potassium (K) decaying to form the daughter isotope argon, (Ar). The daughter isotope argon does not start to accumulate until a volcanic eruption takes place, at which point the radioactive decay clock starts. Over a very long period of time, almost all of the radioactive K will decay to form Ar. The time that it takes for half of the isotope of K to form Ar is called the “half life,” which in the case of K-Ar is 1.25 billion years. By measuring the ratio of K to Ar in feldspar crystals in ash from a volcanic eruption, the age of the eruption, and therefore the age of the ice in which the ash is found, can be determined.
A simple way to simulate radioactive decay is by making popcorn. Popcorn starts out as unpopped “parent” kernels we’ll call “kernelite, (Ke).” Heating starts the radioactive decay clock and the “kernelite” begins to decay to a new daughter product of popped kernels we’ll call “popcornium, (Pc).” Just like radioactive decay, this process is irreversible, and with enough time all the kernelite will decay to popcornium. The “half-life” of kernelite is the time after which half of the kernels have popped, transforming to popcornium.
The following experiment using the “kernelite/popcornium” system can help understand radioactive decay. After acquiring the data, the next step is to plot the “decay” curve of kernelite, and the “accumulation” curve of popcornium. Next use these curves first to establish the “half-life” of kernelite, and second to determine the “age” (popping time) for bags of popcorn for which the age is unknown. The experiment involves several steps described below.
Materials
- 10 mini bags of microwave popcorn
- 1 large roll of craft or parchment paper
- Pens and markers
- Master data sheets for recording pop times and kernel counts
- Excel version (three worksheets include all resources below)
- PDF version (separate pages)
- Graph paper (if preferred)
Procedure
- Using a microwave oven, pop 6 bags of popcorn one at a time. Label six of the bags with predetermined popping times t=0 sec, 10 sec, 20 sec, 30 sec, 40 sec, and 50 sec. Preset the microwave time for 2 minutes. Even though you will only be popping for a short time, some time will elapse as popcorn heats up and begins popping. The “radioactive decay” timing begins when you hear the first kernel of popcorn pop. Use the microwave timer or a stopwatch to measure the popping time. Turn the microwave off and remove the bag as soon as the predetermined (decay) popping time is reached.
- Label the remaining bags A, B, C, and D. Pop each for time intervals between 10 and 50 seconds. Secretly record the time for each of the bags. These are the unknown samples for which the “age” (popping time) will be determined.
- Divide the class into 10 groups. Each group will open a bag of popped corn, spread the contents on a large sheet of parchment paper and carefully count and record the number of a) kernelite b) popcornium kernels. Record your results on the data sheet.
- Plot the results from bags with known popping time intervals on the graph with time (T) on the horizontal axis, % kernelite (parent) ratio on the vertical axis (0-100% scale). On the same graph, also plot the % popcornium (daughter). You can now determine the “half-life” of the Ke/Pc system by finding the point where both % Ke and % Pc are 50% (where the two plotted lines cross) and reading the time from the horizontal axis.
- Find the % Ke values from “unknown” bags (A-D) and plot where they intersect your decay curve. Now, determine the unknown “age” (popping time) for each bag by reading the time from the X-axis that corresponds to the measured % Ke. Compare your results to the mystery popping times that were secretly recorded.
- Discuss the ways in which experimental errors can affect your results. How might your experimental popcornium/kernelite decay system differ from a natural radioactive decay process, such as occurs in volcanic ash layers in ice cores? How else might scientists use radioisotopic dating to study climate history and other geologic records?

By: Susie Welch, Nelia Dunbar, Bill McIntosh and Lynn Heizler; April 2009, New Mexico Bureau of Geology and Mineral Resources. Thanks to Matteo Cattadori, a teacher from Italy who inspired this exercise.
This and other geoscience exercises are available at: https://geoinfo.nmt.edu/education/exercises


