Circular 209
The Morrow Play Project
NMBGMR | PRRC | GO-TECH
Overview | ArcView Project | ArcExplorer Project | Pooltools | PDFs | Morrow Play
This is the documentation for Circular 209
which is available on CDROM
which is available on CDROM
|
General Information
The Morrow Formation natural gas play of the Delaware Basin region, southeast New Mexico, has recently received considerable industry attention. Despite its current popularity and obvious significant future resource potential, relatively little information has been published as scientific papers or in public databases that are readily and easily accessible using the latest database software. The Morrow Play Project combines public-domain information from a variety of sources into a common GIS map-based format. Users may view a map of Morrow "pools" (fields) or wells and then "point and click" on the map for specific information on these entities.
The following components are integrated into the Morrow Play Project
- A GIS map of Morrow pools and Morrow production wells (in ArcView and ArcExplorer format), displaying numerous layers (wells, pools, township, section lines, etc.) that can be turned on and off by the user. Included are user-selectable links to the databases on the Morrow Play. See detailed instructions on how to use the ArcView or ArcExplorer version of the map.
- Morrow pool database (available in both MS Access and MS Excel formats) accessible as a stand alone, search-by-query database linked to pool outlines on the GIs map. Read tips on how to access the data on Morrow pools in all available formats.
- Production data (available in both MS Access and MS Excel formats) - a stand alone, search-by-query database linked to well spots on the GIs map. Read explanations of all available options to access the data stored in the production database.
- A Morrow specific bibliography. To read it as an html document open the file bibligraphy.htm or open the file bibliography.doc to view it as a MS Word file.
Morrow Pool Database
Data SourcesThe foundation of the pool database is derived from a database compiledfor the Atlas of Major Rocky Mountain Gas Reservoirs (Robertsonet al., 1993) published by the New Mexico Bureau of Geology and Mineral Resources. Cumulative field production was derived from ON-GARD public-domain digitaldata distributed by the New Mexico Oil Conservation Division and from publishedannual reports published by the New Mexico Oil and Gas Engineering Committee. Other published sources are referenced within the database in the "REFERENCE"field.
Accessing information from the database is simple and easy. The followingoptions are available to search through the data on Morrow pools:
- Option 1: To work with the Excel file with data on Morrow pools simply open morrow-pools.xls. The pool data stored in the database include: its DOE code, OCD number, information about location of a pool (its township, range, etc.), cumulative production from the pool, properties of the reservoir rock (e.g.: porosity, permeability, etc.), properties of the produced fluid (composition of the produced gas). A list below explains abbreviations used in the pool table.
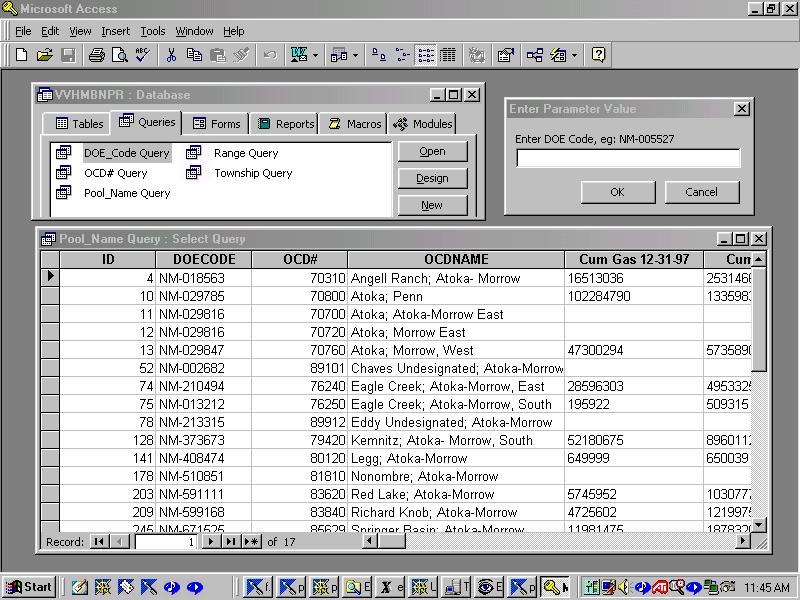
- Option 2: To use MS Access pool database open the file Morrow-pools.mdb. See the list of the abbreviations below, which specify pool table attributes. The data can be queried based on the pool name, DOE code, OCD number, range or township of a pool.
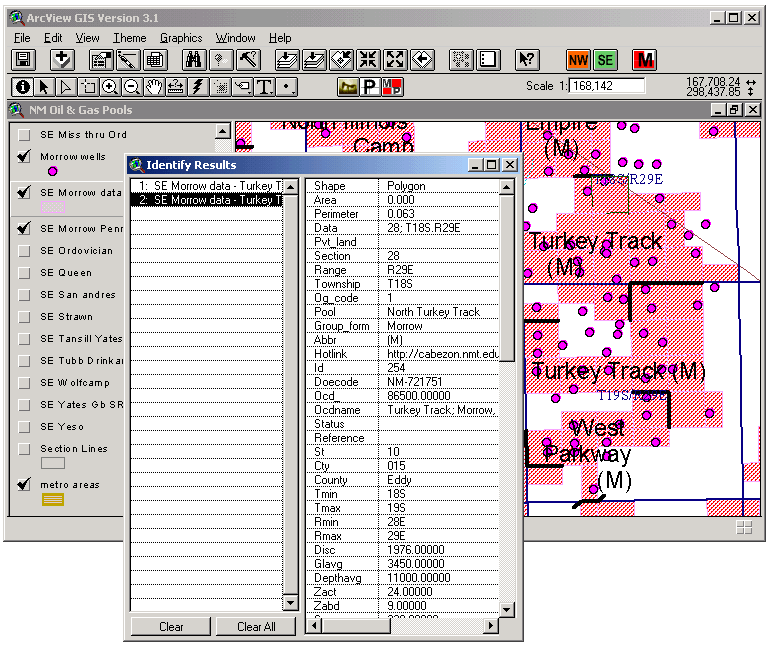
- Option 3: Query pool data by clicking a pool outline on a GIs map of Morrow pools: Open the map either in ArcExplorer format, Morrow.aep, or in ArcView format, (AV-NM-poolmaps.apr). Make the 'SE Morrow data' theme visible and active by using the 'Morrow button'
 in the ArcView project. In ArcExplorer and ArcView you can do this manually by clicking on the checkbox (see overview) of the themes 'Morrow wells', 'SE Morrow data', and 'SE Morrow Penn' (if you want pool annotations) and then make the theme of interest active (surrounded by a gray box) by clicking on the text. Use the 'identify tool'
  by clicking any pool on the map within its outline to see available information on that particular pool.
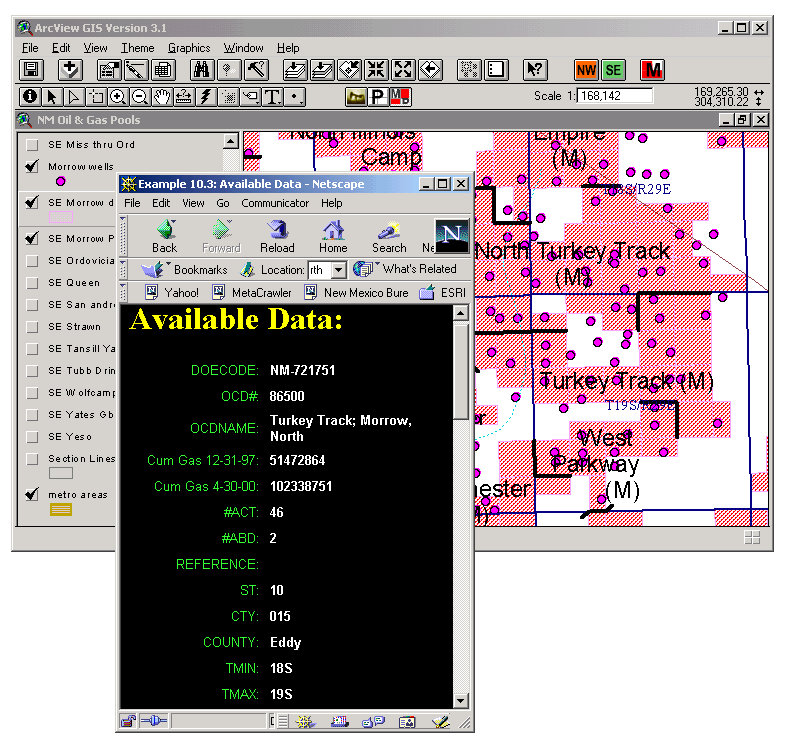
In addition, when using the ArcView project, the user can click on the 'Morrow pool data tool'and click within a pool outline to query information from a web database on the pool. The available data will be displayed in the default web browser.
DOECODE |
Department of Energy assigned field code |
OCD# |
NM Oil Conservation Division (OCD) assigned pool code |
OCDNAME |
OCD assigned pool name |
Cum. Gas 12-31-97 |
Cumulative gas for pool, 1997 report of NM Oil and Gas Engineering Committee |
Cum. Gas 4-30-00 |
Cumulative gas for pool, digital ONGARD data from OCD |
#ACT |
Current number of active wells reported in pool from ONGARD data |
#ABD |
Current number of abandoned wells reported in pool from ONGARD data |
REFERENCE |
Applicable literature reference, see bibliography for complete citation |
ST |
State code (API) |
CTY |
County code (API) |
COUNTY |
County name |
TMIN |
Township, minimum, for determining general location of pool |
TMAX |
Township, maximum, for determining general location of pool |
RMIN |
Range, minimum, for determining general location of pool |
RMAX |
Range, maximum, for determining general location of pool |
DISC |
Year of Discovery |
GLAVG |
Ground Level, Average for pool |
DEPTHAVG |
Average producing depth |
SPACE |
Spacing in acres approved by OCD |
ACRETOTAL |
Total acres in pool |
NETPAY |
Net pay/perforations |
POROSIMEAN |
Average porosity |
PORRANMIN |
Minimum porosity of "pay" |
PORRANMAX |
Maximum porosity of "pay" |
HORPERMEAN |
Average permeability |
INRESVTEMP |
Initial reservoir temperature |
TEMPMEAS |
Measured temperature |
INRESPRESS |
Initial reservoir pressure |
PRESSMEA |
Measured pressure |
RESPREGRAD |
Reservoir pressure gradient |
INITIALSW |
Initial water saturation |
PRODFLUIDS |
Fluids produced |
PRORATEGAS |
Prorated gas? |
TIGHTRESER |
Tight reservoir designation? |
SUBQUALGAS |
Subquality gas? |
CASEDHOLE |
Casing program |
PROVDEVRES |
Proved developed reserves |
PRODDECLRI |
Effective decline rate |
GASGRAVITY |
Gas gravity |
HEATVALUE |
BTU value |
METHANE |
%, this and others from old U.S. Bureau of Mines testing/compilations |
ETHANE |
% |
PROPANE |
% |
BUTANE |
% |
PENTANE |
% |
HEXANEPLUS |
% |
CO2 |
% |
N2 |
% |
HE |
% |
#WELLS |
number of wells used to established % above |
SALINITY |
Salinity of formation water |
TDS |
Total dissolved solids |
RW |
Formation water resistivity |
TEMPRES |
Reservoir temperature for salinity measurements |
METHODRW |
Method of determining Rw |
CLASRESER |
Department of Energy reservoir classification (see Robertson et al., 1993) |
STRUCOMP |
Department of Energy, structural compartmentalization (see Robertson et al., 1993) |
Morrow Production Database
The Morrow production database is a part of the New Mexico petroleum productiondatabase developed and maintained by the Petroleum Recovery Research Center(PRRC)/Go-Tech. It contains production data from the period 1993-2000.Access to the data is provided through the following options:- Option 1: Open the file prod_data.xls to work with MS Excel file, which lists morrow wells production data sorted based on their API numbers.
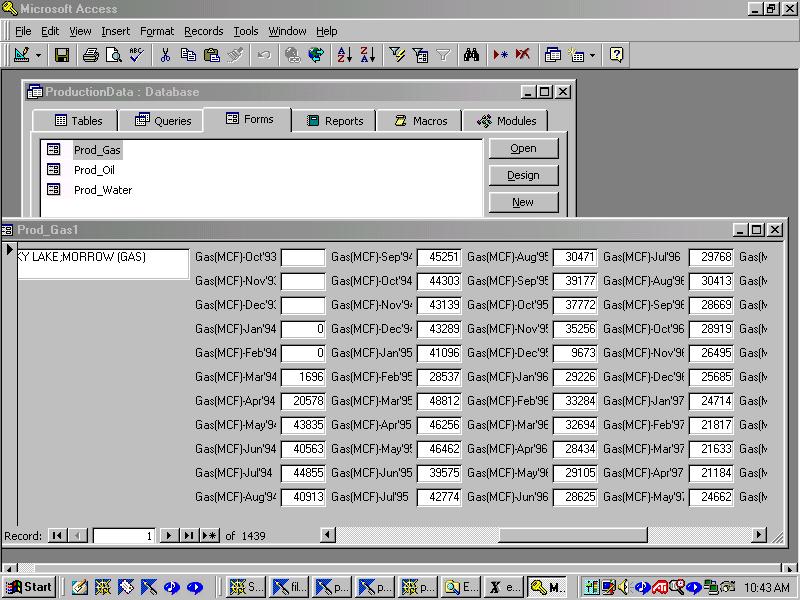
- Option 2: To work with the MS Access production database open the file ProductionData.mdb. Production data in the Access database are divided into a number of tables based on the year of production and a pool the particular well is producing from.
-
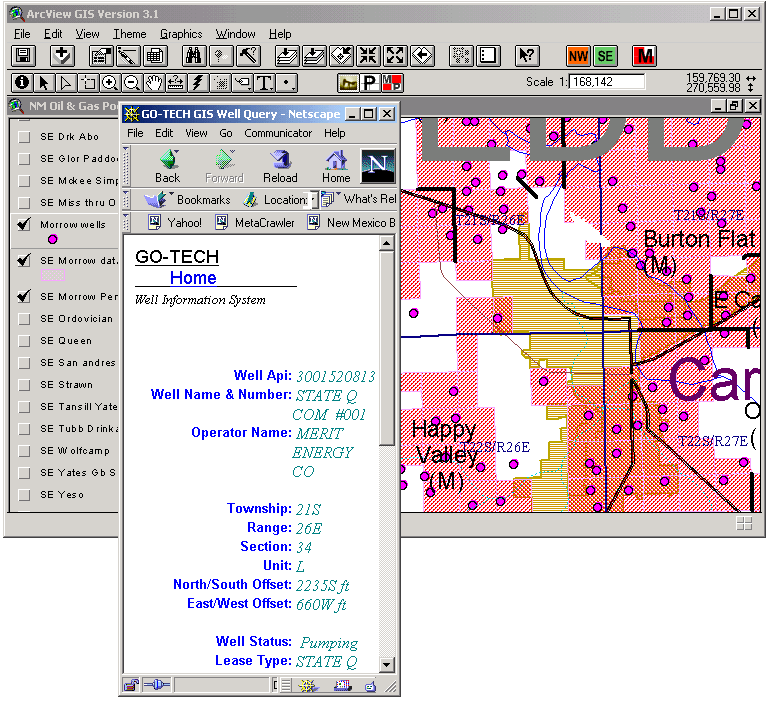
Option 3: To query the production data by clicking a well spot on a GIs map, open the map either in ArcExplorer format (Morrow.aep), or as an ArcView project (nm-poolmaps.apr). Make the 'Morrow wells' theme visible and active by using the 'Morrow tool'
 (in ArcView) or by clicking on the checkbox and then on the text (see above). Use the 'identify tool'
  to click a well spot on the map to see its available production data.
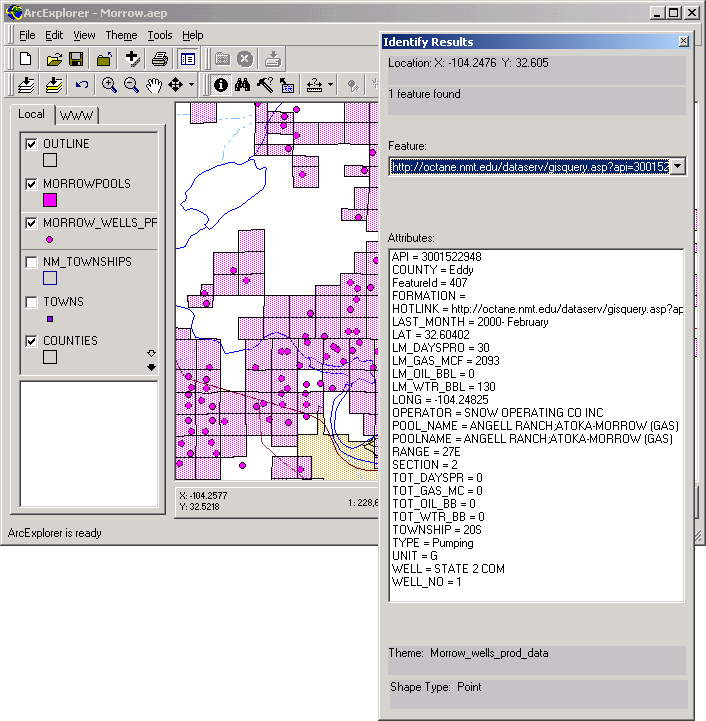
When using ArcView map you can use the 'hotlink tool' ![]() and click a well to query information from the production web database. The available data will be displayed in the default web browser.
and click a well to query information from the production web database. The available data will be displayed in the default web browser.
